
AIML Level-1 Report
28 / 7 / 2024
Task 1-Linear and Logistic Regression - HelloWorld for AIML
Linear Regression:
Linear regression is a machine learning technique that predicts a numerical outcome by finding the best-fitting straight line through a set of data points, representing the relationship between one or more input variables and the target variable.
Predicted the price of a home, based on multiple different variables through following steps:
1.Load the required libraries
2.Load the Boston Housing dataset from the original source
3.Prepare the data and target variables
4.Create a Data Frame for better visualization
5.Compute the statistics
6.Print the count and mean
7.Split the data into training and testing sets
8.Initialize the linear regression model
9.Fit the model on the training data
10.Predict on the test data
11.Print the model's performance
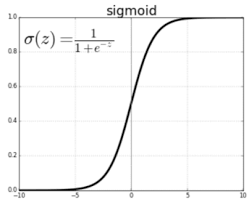
Logistic regression:
Logistic regression is a machine learning model used for binary classification tasks. It predicts the probability that a given input belongs to one of two categories by modeling the relationship between the input features and the outcome using a logistic function, which outputs values between 0 and 1.
Trained a model to distinguish between different species of the Iris flower based on sepal length, sepal width, petal length, and petal width as follows:
1.Load the necessary libraries
2.Load Iris Dataset
3.Split Data into Train and Test Sets
4.Create and Train Logistic Regression Model
5.Make Predictions
6.Evaluate Model Performance
7.Plot Decision Boundaries
Task 2-Matplotlib and Data Visualisation
1.Explored the various basic characteristics to plots as given below, with python libraries:
• Set axes label
• Set axes limits
•Create a figure with multiple plots using subplot
•Add a legend to the plot
•Save your plot as png
2.Explore the given plot types:
•Line and Area Plot
•Scatter and Bubble Plot using Iris dataset
•Bar Plot
1.Simple
2.Grouped
3.Stacked
4.Histogram
Multivariate distribution for the Iris dataset using the given dataset for a classification task.
Task 3-Numpy
Numpy is a powerful Python library used in machine learning and data science for numerical computing. It provides support for working with large, multi-dimensional arrays and matrices, along with a collection of mathematical functions to operate on these arrays efficiently.
Using Numpy Generated an array by repeating a small array across each dimension and Generated an array with element indexes such that the array elements appear in ascending order.
Task 4-Metrics and Performance Evaluation
1.Regression Metrics:
Regression metrics are used to evaluate the performance of regression models, which predict continuous outcomes. These metrics help measure how well the model's predictions match the actual values. Here are some simple and commonly used regression metrics.
2.Classifiaction Metrics:
Classification metrics are used to evaluate the performance of classification models, which predict categorical outcomes. These metrics help determine how well the model's predictions match the actual classes.
Here is an example for the classification metricslink
Task 5 - Linear and Logistic Regression - Coding the model from SCRATCH
Linear Regression:
Implementation of the code:
1.Initialize Parameters: Start with initial guesses for w and b.
2Define the Cost Function: We use Mean Squared Error (MSE) to measure the error.
3.Optimize Using Gradient Descent: Adjust w and b to minimize the cost function.
Testing the model:
To evaluate the model’s performance, we can compute the Mean Squared Error (MSE), a commonly used metric for regression models. MSE measures the average squared difference between predicted and actual values, with lower values indicating better performance.
Comparing it with sci-kits built-in algorithm for various datasets:
1.Used both simple linear datasets and some standard datasets from scikit-learn (e.g., the Boston housing dataset, diabetes dataset).
2.Train both models on each dataset.
3.Evaluate and compare their performances using the Mean Squared Error (MSE).
Logistic Regression:
Implementation of logistic Regression:
1.Sigmoid Function: This function maps predictions to probabilities, which is essential for binary classification.
2.Initialize Parameters: Initialize the weight vector w and bias b for the logistic regression model.
3.Define the Cost Function: Use binary cross-entropy to measure the difference between predicted probabilities and actual labels.
4.Optimize Using Gradient Descent: Update w and b by minimizing the cost function.
Testing the Model:
To test the logistic regression model and evaluate its performance, we can calculate metrics such as Accuracy, Precision, Recall, and F1 Score.
Comparing it with sci-kits built-in algorithm for various datasets:
1.Use Different Datasets: We will generate synthetic datasets and use standard datasets available in scikit-learn.
2.Train Both Models: Train our custom model and the scikit-learn model on each dataset.
3.Evaluate Performance: Compute evaluation metrics (like Accuracy, Precision, Recall, F1 Score) for both models.
Task 6 - K- Nearest Neighbor Algorithm
1. Implementation of KNN
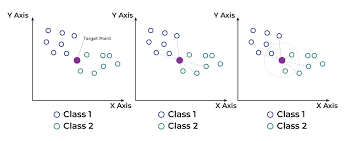
1.K-Nearest Neighbors (KNN) is a straightforward supervised learning algorithm used for both classification and regression. It works by identifying the 'k' closest data points to a query point based on a distance metric, often Euclidean distance. For classification, it assigns the most common label among these neighbors, while for regression, it averages the values. KNN is non-parametric, meaning it makes no assumptions about the underlying data distribution, but can be computationally intensive with large datasets. Its performance depends on the choice of 'k' and the distance metric, which can affect its accuracy.
Here is an example for Implementation of KNN using sci-kit's neighbors. Implementation
2. Understanding the algorithm:
Here are some important points to understand K-Nearest Neighbors (KNN) in machine learning:
Instance-Based Learning:
KNN is a lazy learning algorithm, meaning it doesn't explicitly train a model but instead stores the training data and uses it for prediction during testing.
Distance Metric:
The algorithm relies on a distance function (commonly Euclidean, Manhattan, or Minkowski) to find the 'k' nearest neighbors to the input point.
Choice of 'k':
The value of 'k' (number of neighbors) significantly affects the model's performance. A small 'k' may lead to overfitting (sensitive to noise), while a large 'k' may over smooth the decision boundary (underfitting).
Non-Parametric:
KNN makes no assumptions about the underlying data distribution, making it flexible for various types of data but potentially inefficient with large datasets.
Computation Cost:
Since KNN stores and checks all data points during prediction, it can be computationally expensive for large datasets, making optimization techniques like KD-trees or Ball trees important in practice.
Scaling and Normalization:
KNN is sensitive to the scale of features, so it is crucial to normalize or standardize data before applying the algorithm.
Applications:
KNN: is widely used for classification tasks, like handwriting recognition and image classification, but can also be applied to regression problems.
3. Implemented a KNN from scratch and compared with sci-kit's built in method for different datasets.
Task 7: An elementary step towards understanding Neural Networks
Neural Networks :
Neural networks are AI models designed to mimic how the human brain processes information. They consist of interconnected layers of nodes (neurons) that work together to learn patterns from data. Neural networks can solve complex problems like image recognition, language translation, and prediction.
Types of Neural Networks:
Artificial Neural Networks (ANNs):
The basic type, made of fully connected layers. Commonly used for simple tasks like regression or classification.
Convolutional Neural Networks (CNNs):
Designed for image processing, using filters to detect patterns like edges and shapes. Great for image classification and object detection.
Recurrent Neural Networks (RNNs):
Built for sequential data like text or time series. They have memory, making them useful for tasks where the order of data matters.
Long Short-Term Memory (LSTM):
A type of RNN that can remember long-term dependencies. Ideal for tasks like text generation and time series forecasting.
Generative Adversarial Networks (GANs):
Consist of two networks—one generates new data while the other evaluates it. GANs are used to create realistic images, videos, or art.
Large Language Model (LLM):
A Large Language Model (LLM) is a type of artificial intelligence (AI) model designed to understand and generate human-like text. These models are trained on vast amounts of text data, enabling them to perform a wide range of language-related tasks such as answering questions, translating languages, summarizing text, and even generating creative content. Blog Post
Task 8: Mathematics behind machine Learning
Curve-Fitting:
Curve fitting is the process of finding a mathematical function that best fits a set of data points. In machine learning, this concept is used in algorithms like linear regression to model the relationship between input and output data. By optimizing parameters through methods like least squares, we can minimize the error between predicted and actual values. This demonstrates that machine learning relies on mathematical techniques to learn patterns and make accurate predictions.
Curve-Fitting for a function y1=mx1+b
Fourier-Transforms:
Fourier series is important in machine learning for breaking down complex, repeating data into simple sine and cosine waves. This makes it easier to find patterns and process signals, like in image analysis or time-series forecasting. By converting data into the frequency domain, machine learning models can handle noise and identify key patterns more effectively.
Task 9: Data Visualization for exploratory Data Analysis
This is an advanced library, more dynamic than the generally used Matplotlib or Seaborn. Data visualization is essential for Exploratory Data Analysis (EDA) as it reveals data patterns, distributions, and relationships. Techniques like histograms, scatter plots, and box plots help in understanding data and identifying trends. Effective visualizations simplify insights and guide further analysis.
Here is an example for the Data Visualization for Exploratory data Analysis click here
Task 10: An Introduction to Decision Trees
A decision tree in machine learning is a predictive model that makes decisions by splitting data into subsets based on the values of input features. Each internal node represents a feature-based decision, branches represent possible outcomes, and leaf nodes provide the final prediction. It's used for both classification and regression tasks, and is valued for its simplicity and interpretability.
Task 11: SVM:
1.Understanding the SVM:
1.Support Vector Machines (SVM) are supervised learning algorithms used for classification and regression that find the optimal hyperplane to separate classes while maximizing the margin between them. They can handle both linear and non-linear data through the kernel trick, making them effective for high-dimensional datasets.
2.Correct and timely diagnosis of Breast Cancer, an exquisite disease is an essential matter in the medical field. Using the concept of Support Vector Machines, detect the possibility of breast cancer.