Level 1 report
2 / 10 / 2024
Marvel Level 1 Tasks
Task 1: Linear and Logistic Regression - HelloWorld for AIML
Linear Regression
Linear Regression is a statistical method used to model the relationship between a dependent variable (often denoted as 𝑦) and one or more independent variables (denoted as 𝑥). The goal is to find the best-fitting line through the data points that minimizes the difference (errors) between the predicted and actual values of the dependent variable.
Logistic Regression
Logistic regression is a statistical method used for binary classification, which predicts the probability of a binary outcome (1 or 0, true or false, success or failure) based on one or more independent variables.
Task 2: Matplotlib and Data Visualization
Matplotlib is a Python library that provides a flexible and powerful way to create a variety of plots and charts, including line plots, scatter plots, bar charts, histograms, and more.
Sine wave
Bar plot
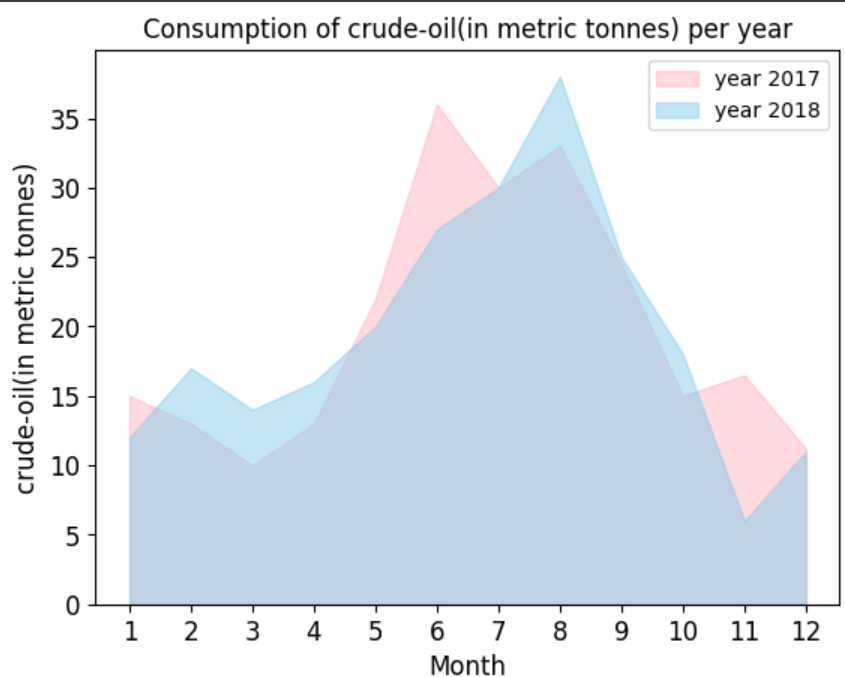
Area plot
Scatter plot
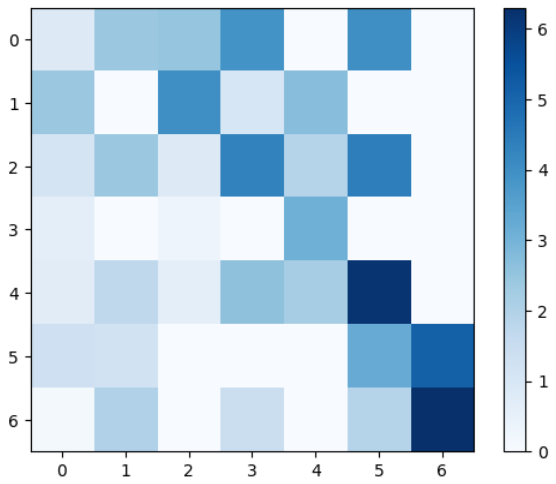
Heat map
Code for Matplotlib and Data Visualization
Task 3: Numpy
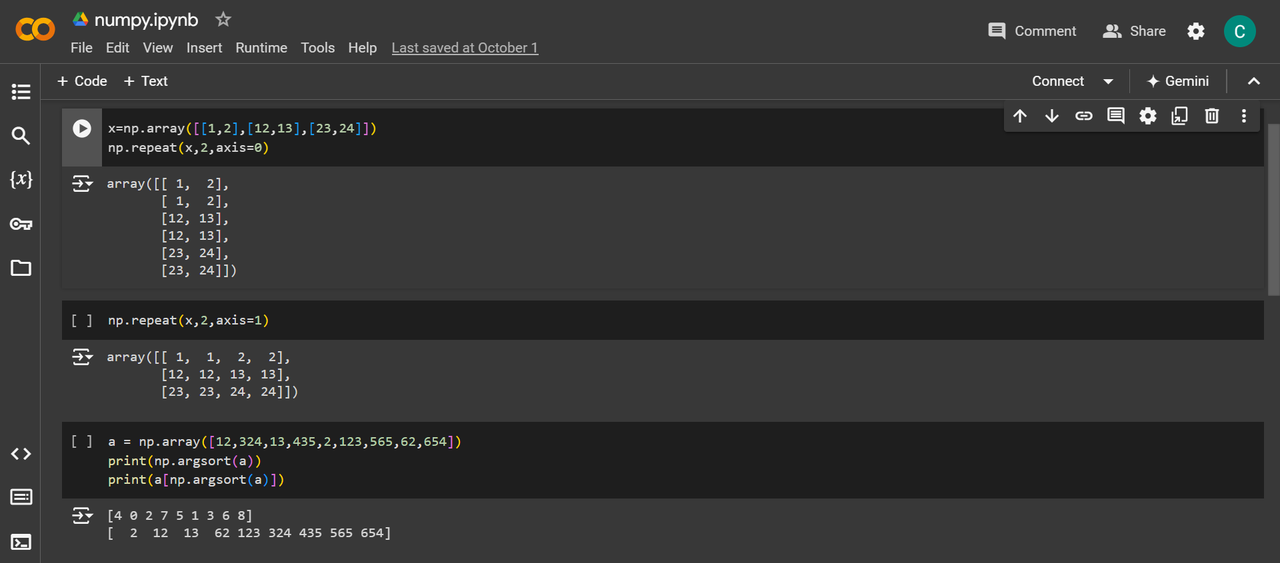
Numpy is a Python library used for numerical computing. It provides support for arrays, matrices, and various mathematical functions to operate on these data structures efficiently.
Task 4: Metrics and Performance Evaluation
Metrics and performance evaluation are essential for assessing the accuracy and effectiveness of machine learning models. They vary based on the type of algorithm—regression or classification.
Regression Metrics
Regression metrics are used to evaluate the performance of regression algorithms, which predict continuous outcomes. Common metrics include Mean Absolute Error (MAE), Mean Squared Error (MSE), Root Mean Squared Error (RMSE), and R-squared (R²).
I've applied the regression metrics for the California housing data
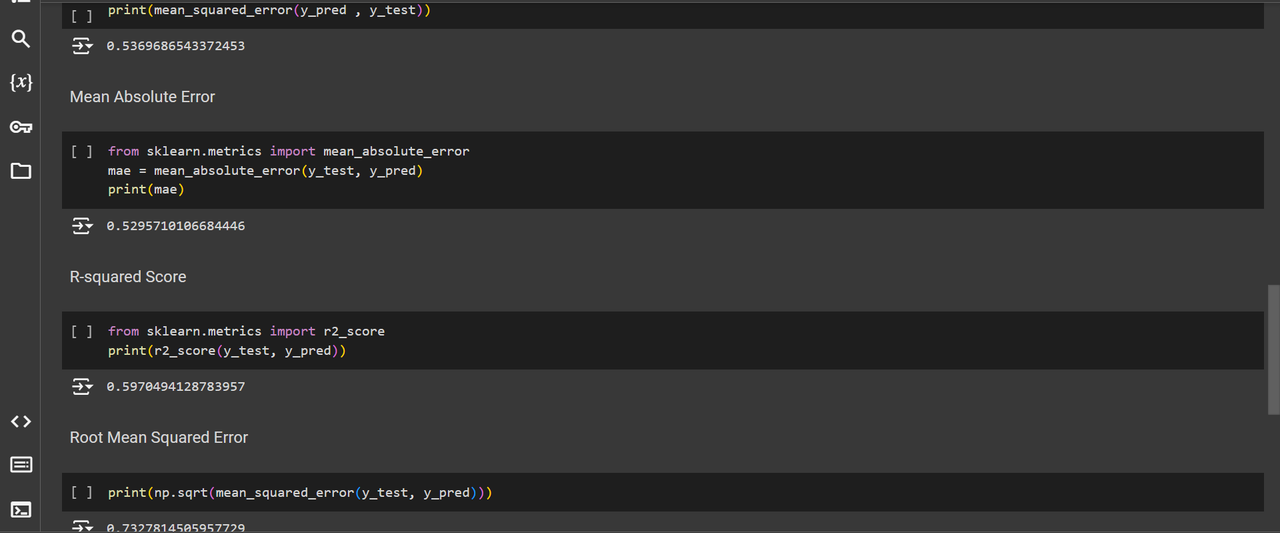
The code for regression metrics
Classification Metrics
Classification metrics assess the performance of classification algorithms, which predict categorical outcomes. Popular metrics include Accuracy, Precision, Recall, F1 Score, and Area Under the ROC Curve (AUC-ROC).
The code for classification metrics
Task 5 - Linear and Logistic Regression - Coding the model from SCRATCH
Linear Regression
By doing linear regression from scratch, I got to know about how the linear regression works in the background and also the formulas it uses and how we can alter the learning rate to get our model fit more effectively to the data that we provide.
Logistic Regression
Here I got to know how this regression differs from the liner regression. It basically works on the sigmoid curve. It predicts the result based on probabilities and lies from 0-1.
Task 6 - K- Nearest Neighbor Algorithm
The K-Nearest Neighbors (KNN) algorithm is a simple, instance-based learning algorithm, used in machine learning for classification and regression tasks. It is supervised learning algorithm which is sometimes also called as lazy algorithm. The main idea behind KNN is that data points with similar features are likely to have similar outcomes. KNN operates based on the principle that "similar things are near each other," meaning it uses the distance between points to make predictions
I also did the kNN from the scratch. It was very helpful in understanding the working logic of the algorithm and I learnt how to use mathematical equations in our code and pre-process the data to get better accuracy rate. The code for kNN from scratch is
Task 7: An elementary step towards understanding Neural Network
Task 8: Mathematics behind machine learning
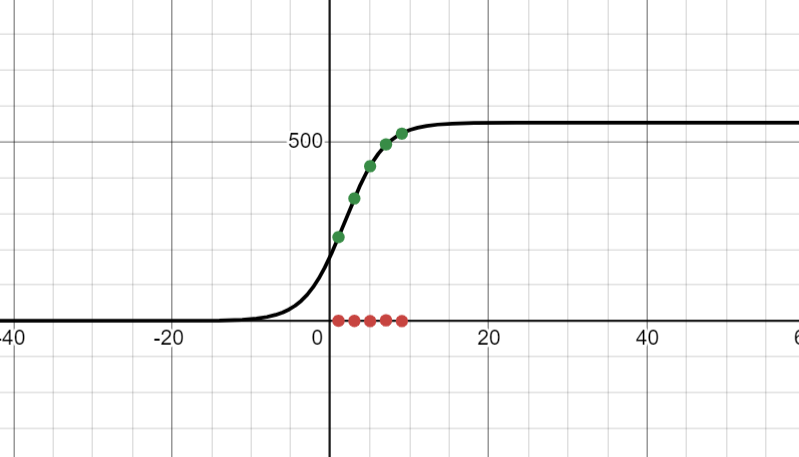
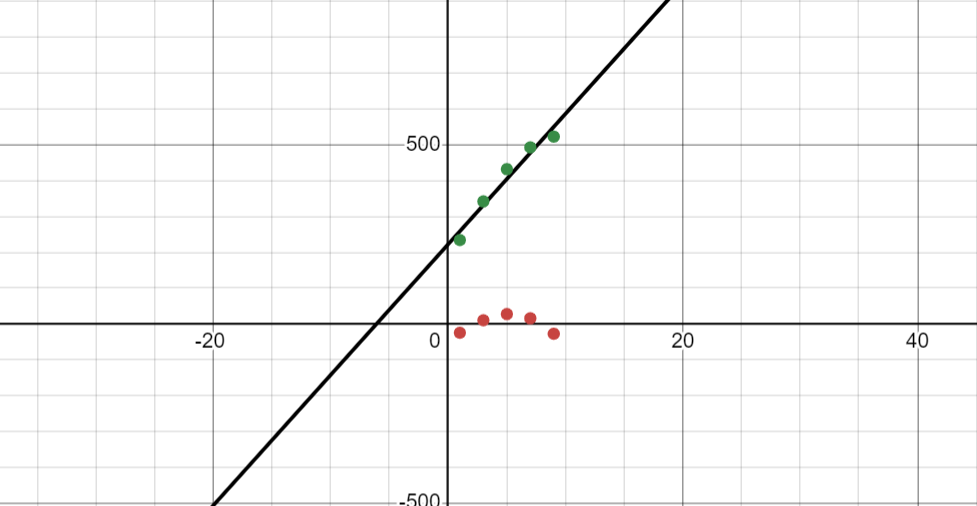
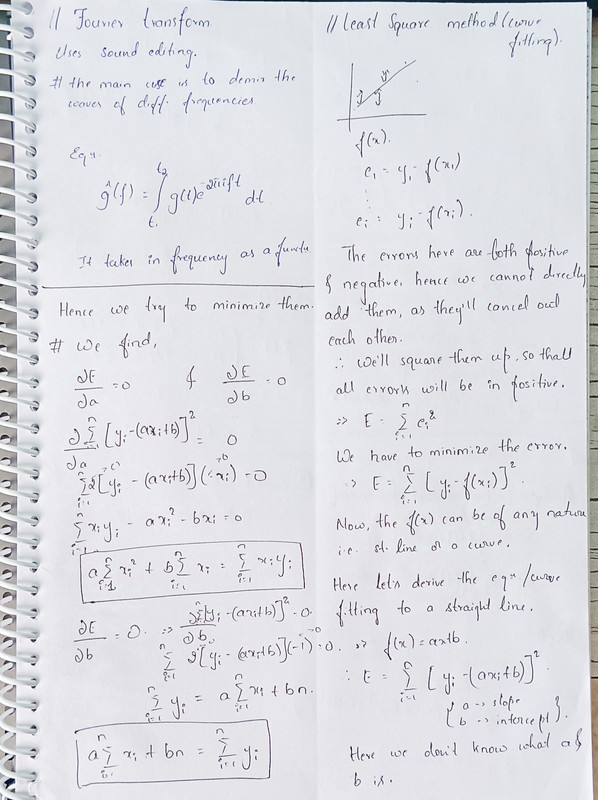
Curve Fitting
I learnt about curve fitting, which is an ML process to find the best fitting curve or function, in order to least error. I learnt how to plot the graph in desmos and plotted a simple graph.
Fourier Transform
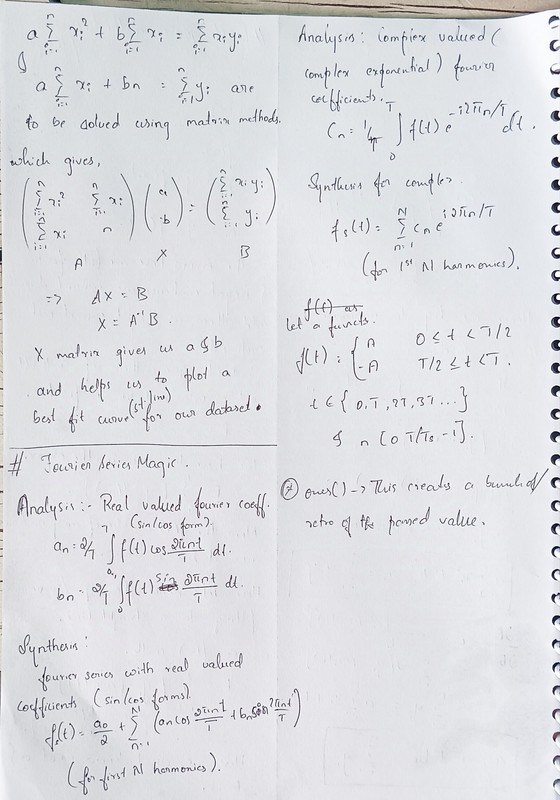
The Fourier Transform is a mathematical technique that transforms a signal from its original domain (often time or space) into a representation in the frequency domain. In simple terms, it decomposes a complex signal into a sum of simpler sinusoidal components (sines and cosines) with different frequencies, amplitudes, and phases. This makes it very easier to analyze and process signals, particularly for understanding frequency-related properties and to add or delete particular frequency wave from the wave.
I've used matlab to write and understand the fourier transform.
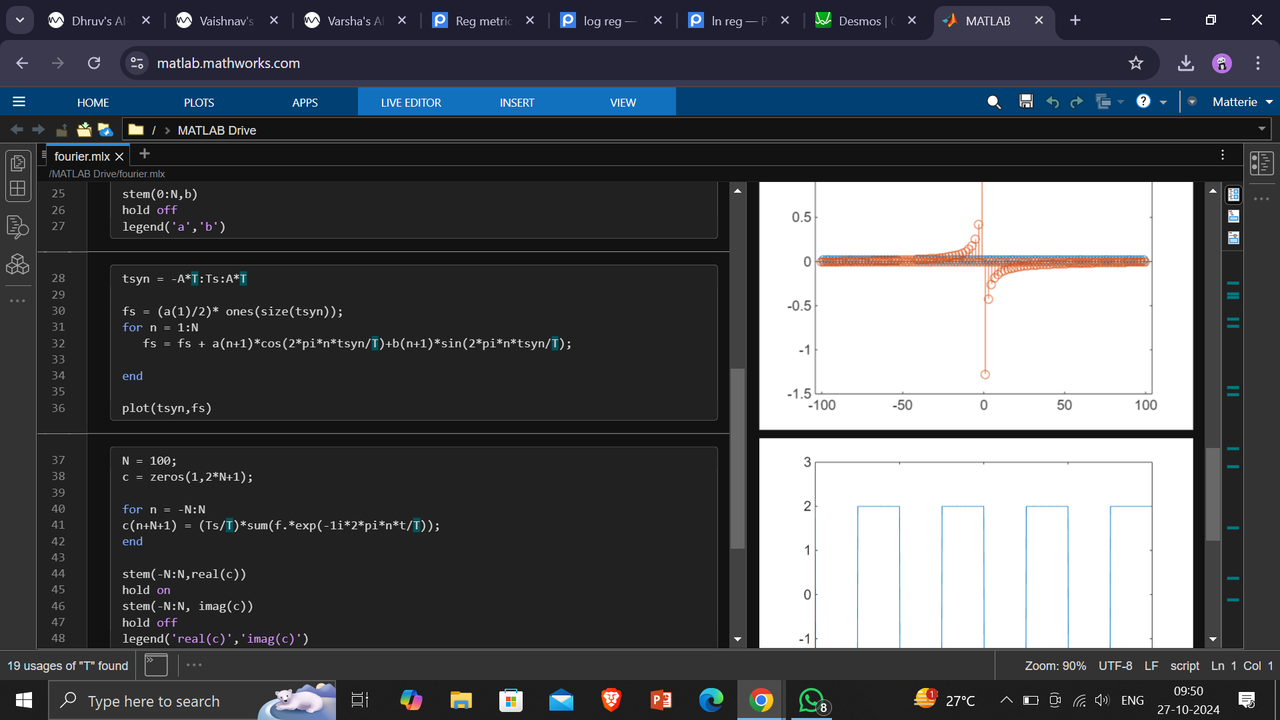
These are my notes for my understanding
Task 9: Data Visualization for Exploratory Data Analysis
Plotly is a powerful open-source data visualization library for Python (and other programming languages like R, MATLAB, and JavaScript). It allows users to create interactive, high-quality visualizations, including line charts, scatter plots, bar charts, histograms, 3D plots, geographic maps, and more.
The code and graphs made using plotly
Task 10 -Decision Tree
A Decision Tree is a popular, supervised machine learning algorithm used for both classification and regression tasks. It works by breaking down a dataset into smaller subsets based on feature values, creating a tree-like model of decisions and their possible consequences. It has some metrics for impurity calculations, like gini impurity, entropy etc..
Here I've calculated how good the tree works, confusion matrix, and how well the model has fit the tree. -The code of decision tree
Task 11 - SVM
SVM-Support Vector Machine is a simplest and the elegant way used for classifications. They make classifications by drawing hyper-planes, between the data to classify them into different groups(Categories). Though they are simplest , they are sensitive to outliers, and sometimes may give the wrong predictions due to outliers. Therefore, we have to process our data before giving it to the SVM.


