
22 / 4 / 2024
Sohan's AIML Level-002 Coursework
Task 1 : "HelloWorld for AIML"
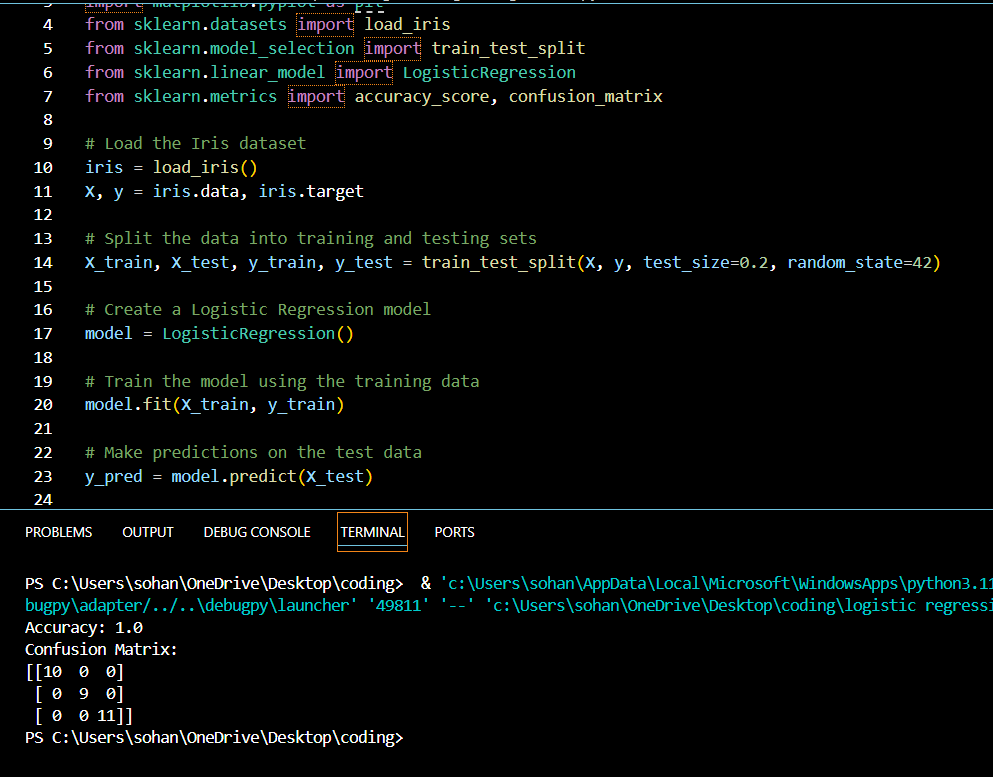
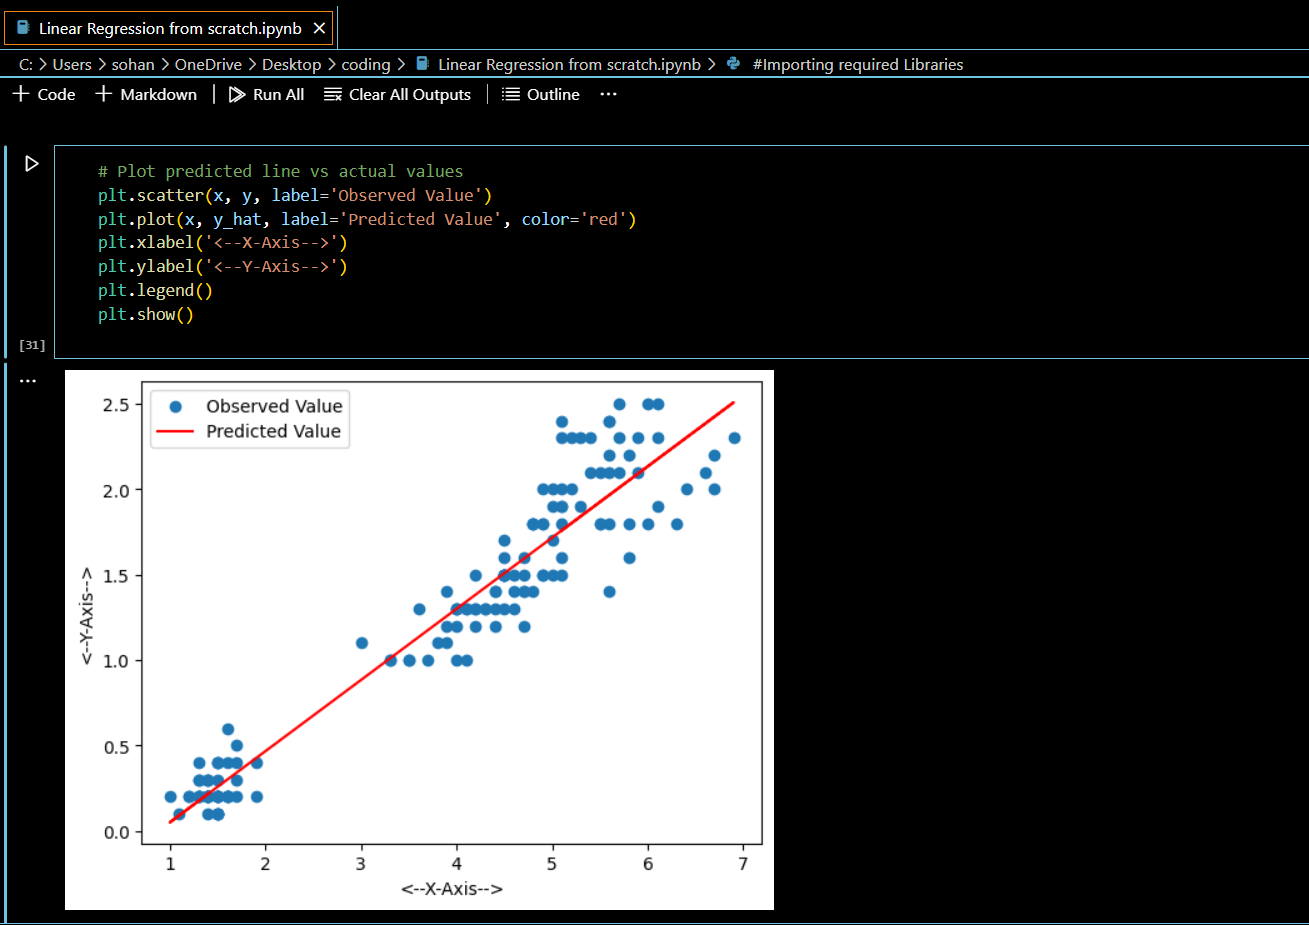
This was my first task. Being new to this world of AI and machine learning , this task laid the foundation of understanding how machine learning works , particularly regression . I followed through the articles and built a simple linear regression model that predicts the housing prices in California and a logistic regression model that predicts species of Iris Flower. I evaluated the Linear Reg. model with MSE and Logistic Reg. model with confusion matrix and accuracy.
Linear Regression
Logistic Regression

Task 2 : Matplotlib
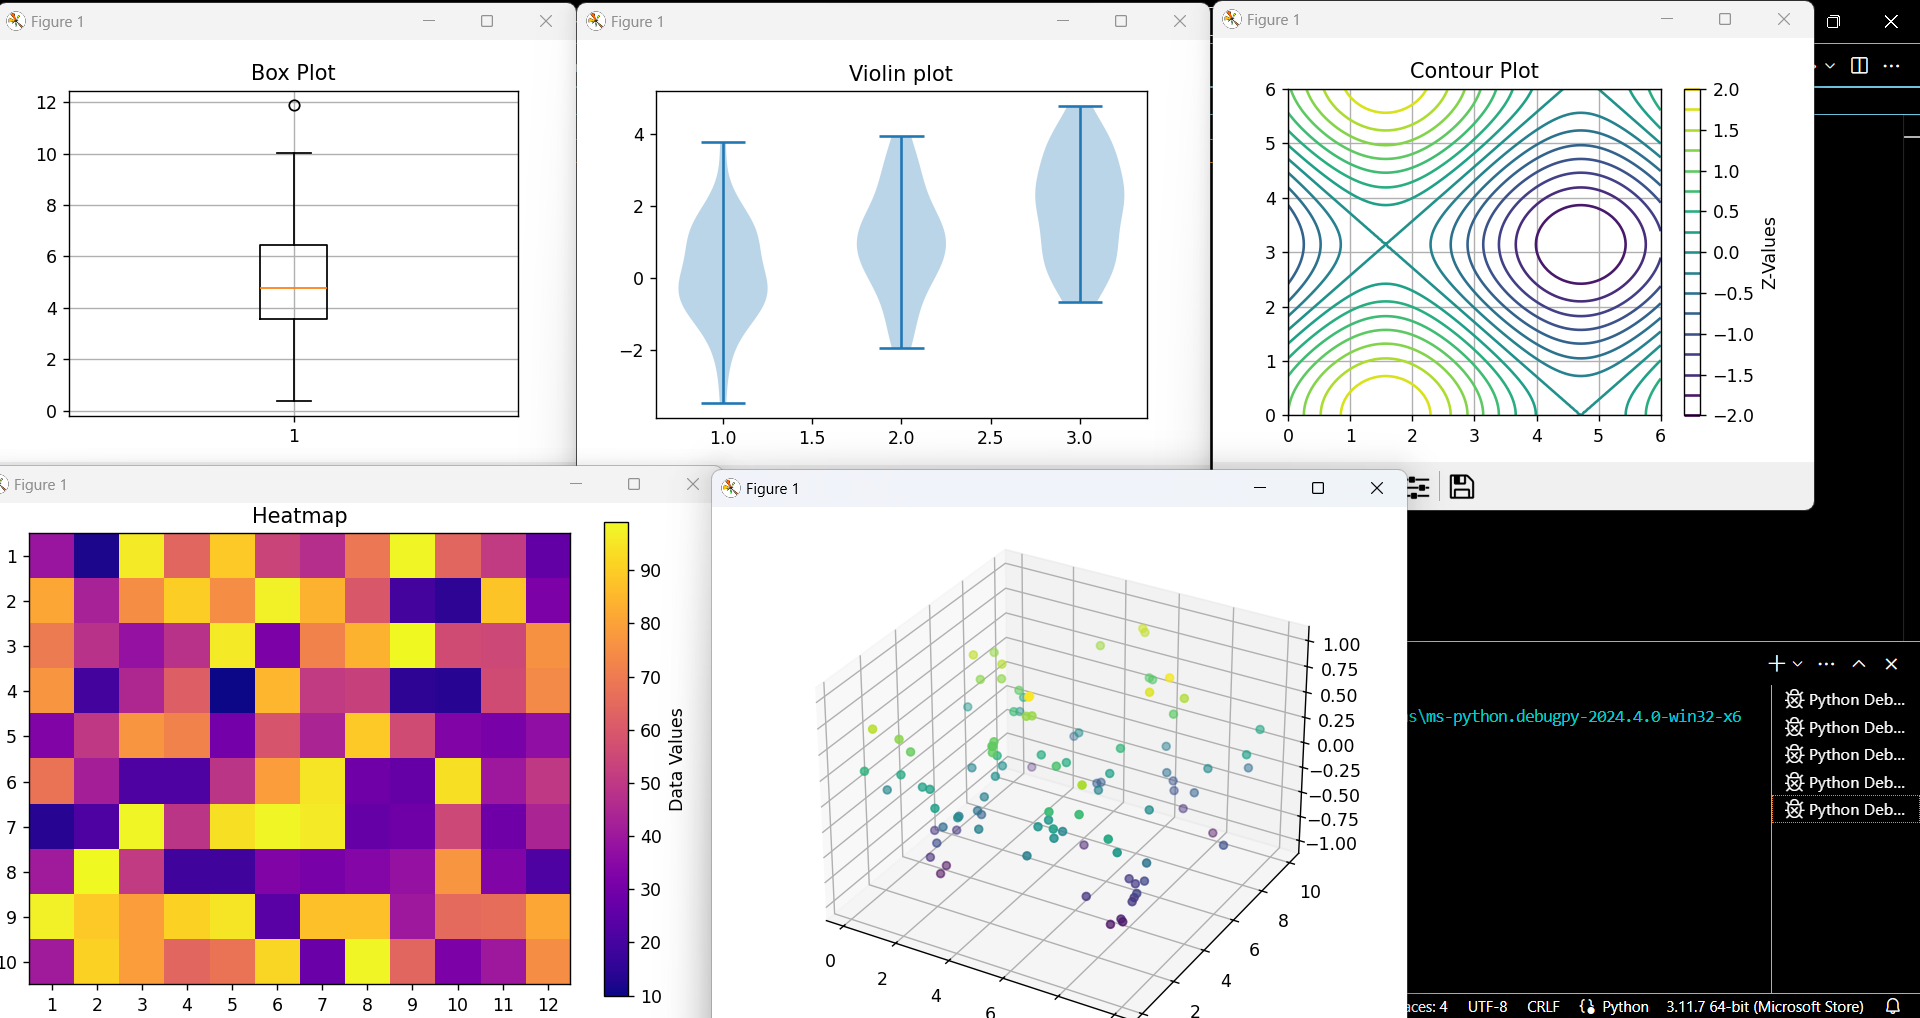
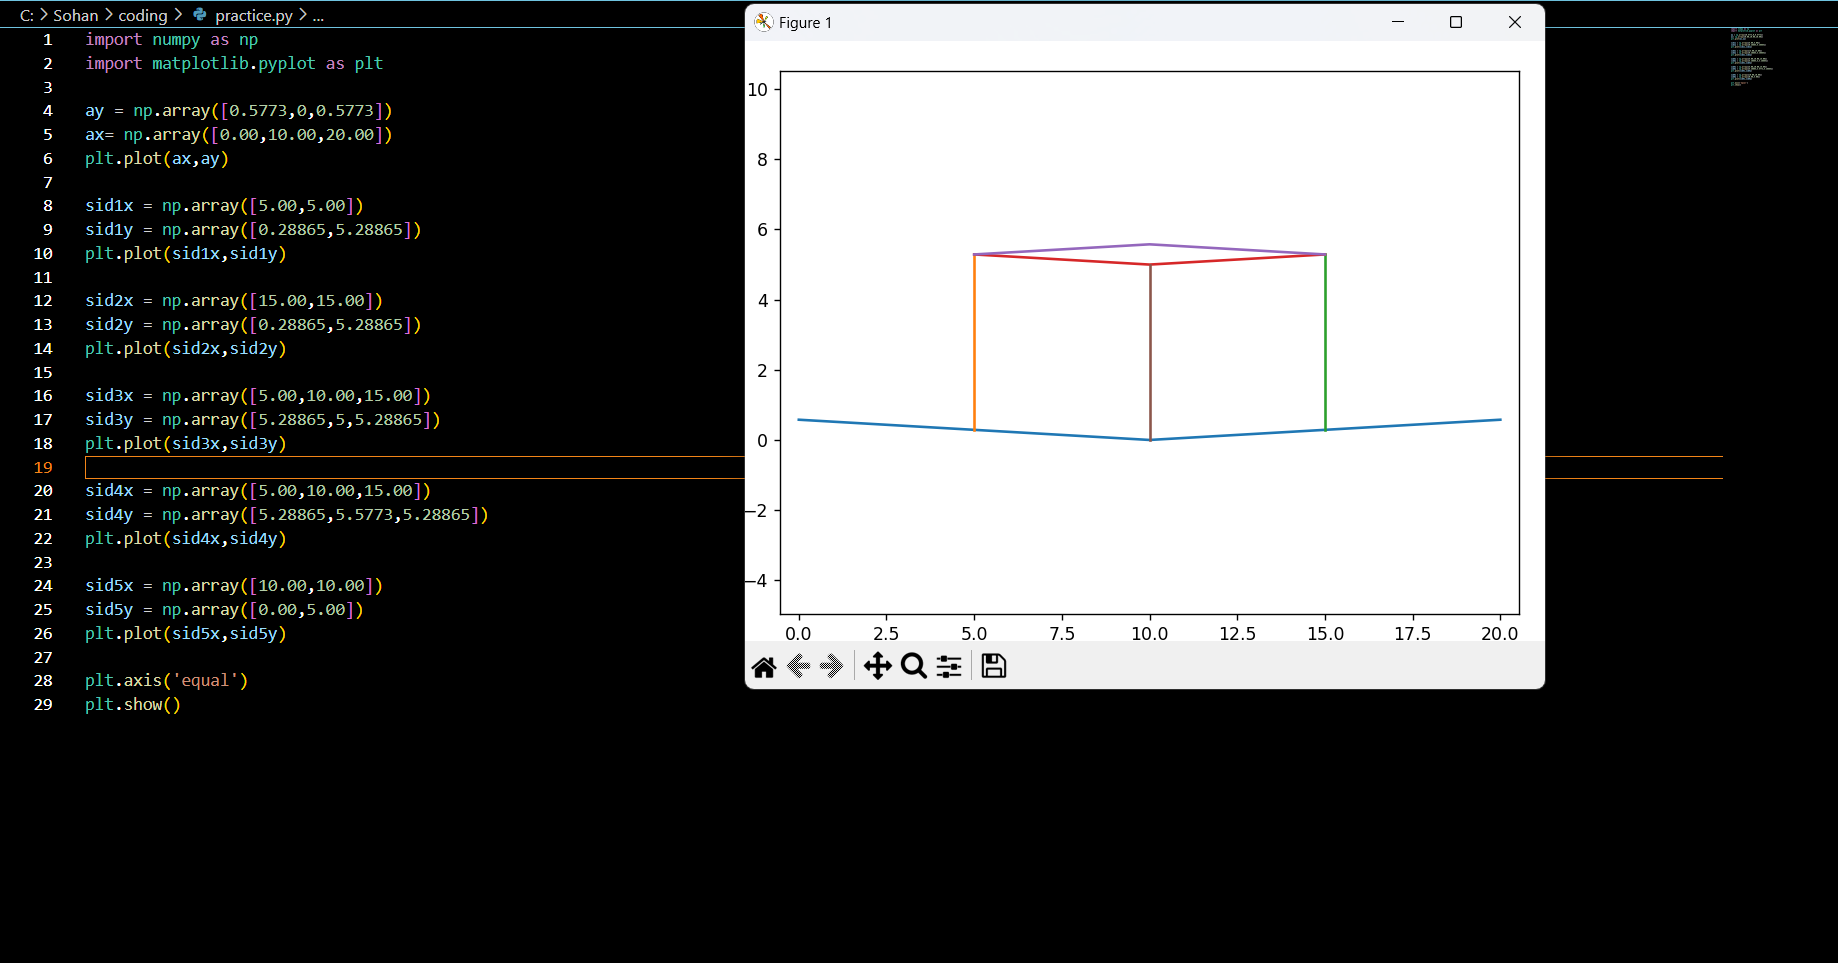
When it comes to handling large amounts of data in machine learning , visualising it is very helpful to understand what we are dealing with. Matplotlib is a poweful tool from which I was able to plot various types of graphs . which were amazing to work with . I also created an isometric projection of a cube as a fun way to understand Matplotlib .

Task 3 : Numpy
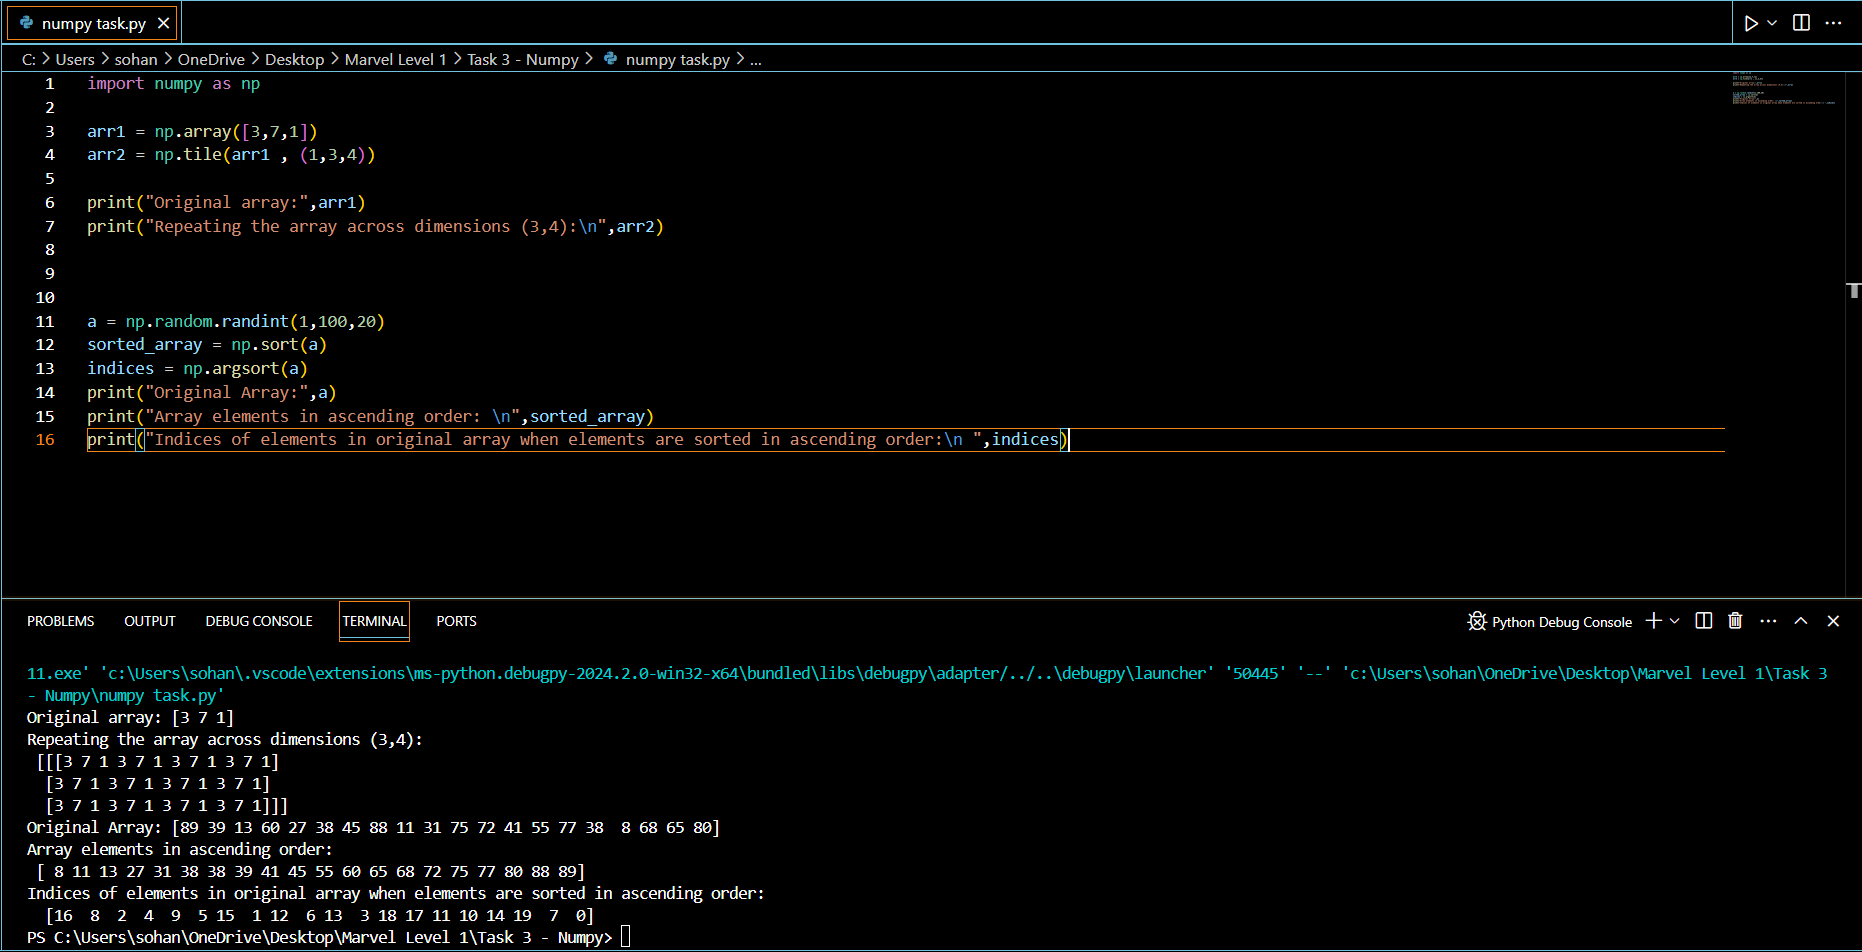
Numpy has been a very useful library, even for some of my personal projects . I have created an array and repeated it across multiple dimensions using np.tile() method . I also created an array of random number , sorted it and displayed the indices of the elements of sorted array corresponding to their respective positions in original array. I also made a small Jupyter Notebook explaining the different methods as I always used to forget the syntax.
Numpy methods
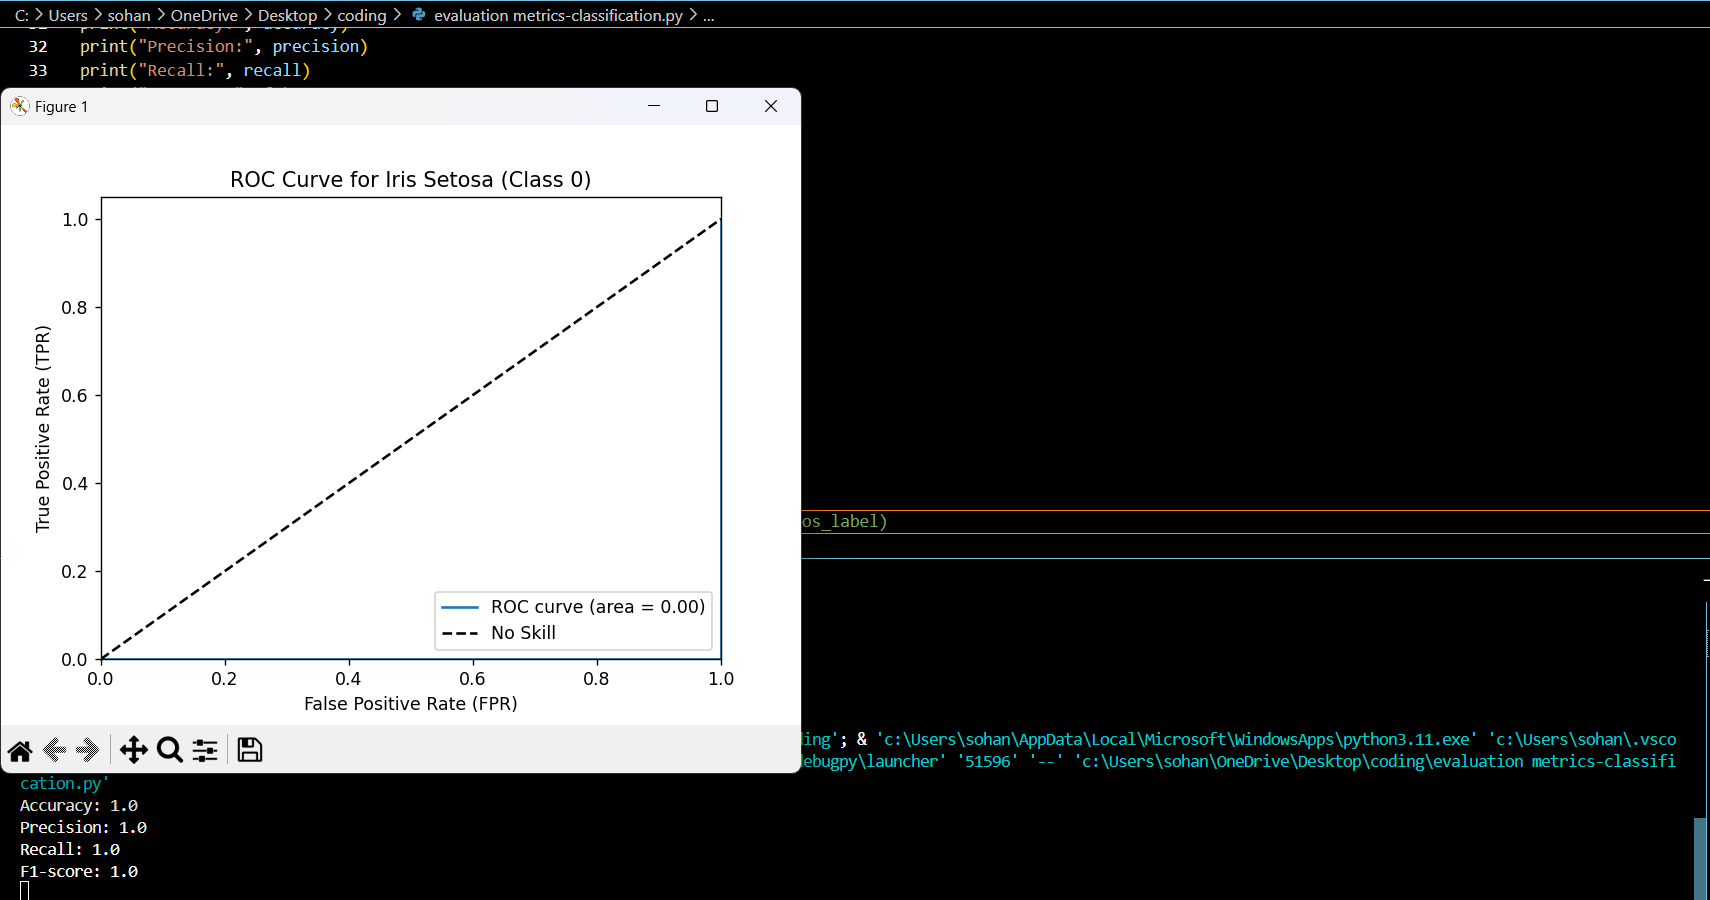
Task 4 : Evaluation Metrics
One of the most fascinating concepts that I learnt while learning AIML was , how there were so many ways to evaluate the accuracy of the machine learning model . My favourite is MSE(Mean Squared Error) as it is simple and elegant. For this task , I made a sample linear regression and decision tree models and used these metrics to evaluate them.
Regression
Classification

Task 5 : Building regression models from scratch
Out of all the tasks , this one took the longest time to learn . Before building the model , I took a detour and learnt pandas , so now when I came back I was able to dwelve deep into the concept and use pandas to handle,visualise and check correlations between columns , which really built my intuition on how regression works . I built a Linear regression model to predict the Petal length of Iris flower based on Petal width , and a logistic regression model that predicts species of Iris flower based on different features provided.
Linear Regression
Logistic Regression

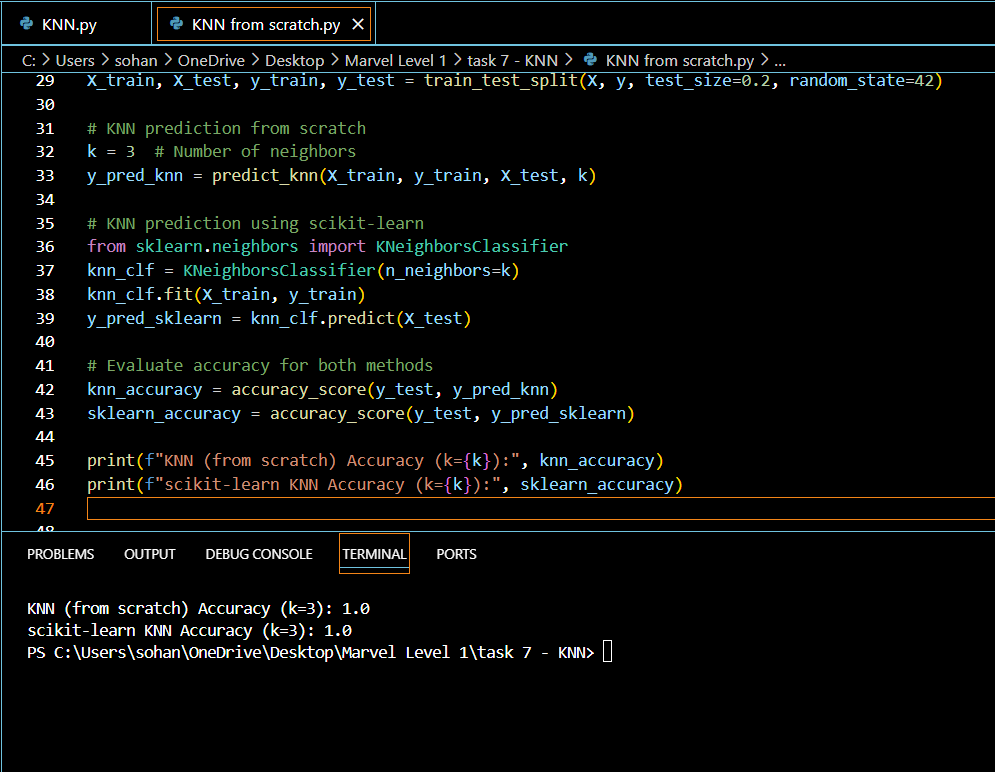
Task 6 : K-Nearest Neighbour Algorithm
This task was interesting , because it "refreshed" my understanding of machine learning. Learning the concept of KNN was a bit difficult at first , but I managed to grasp it . I built 2 models , one where I used sklearn and another built from scratch , both to predict species of Iris flower.
KNN from scratch
KNN using sklearn

Task 7 : Understanding Neural Networks
I took on this task with a very conceptual perspective , with a lesser focus on the code and more on understanding the concept . I think it would be fair to say that I have gained a Tremendous amount of knowledge and understanding of LLMs and Neural Networks . What I would have seen as mysterious and complex a few months ago is now "alright alright" to me . I have written two blogs , one on Neural Networks and the other on LLMs and pushed it to a GitHub repository.
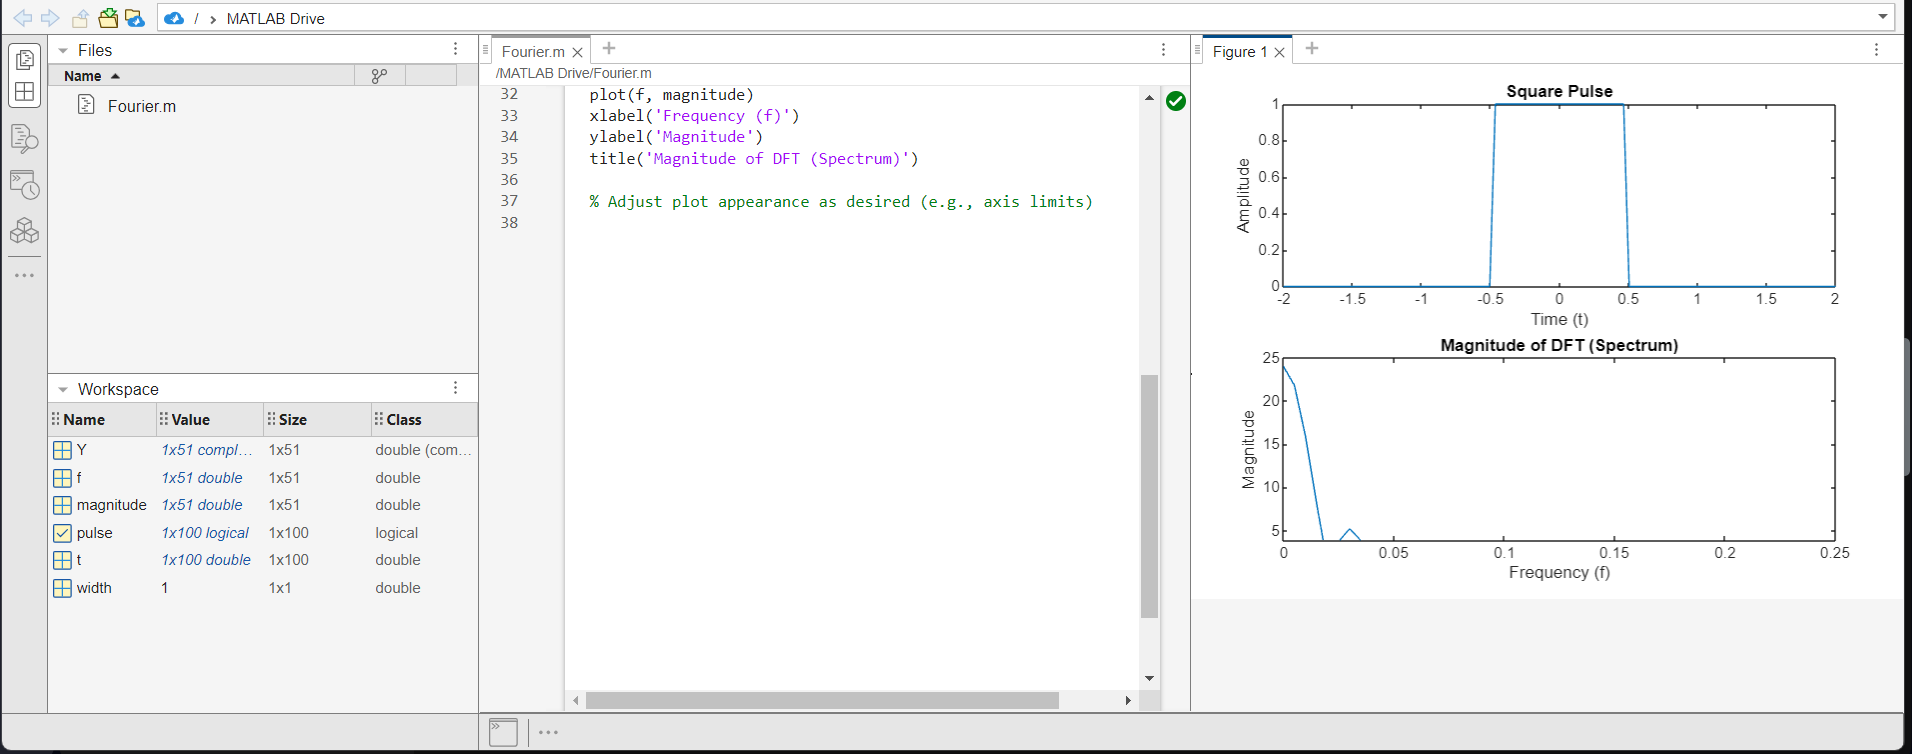
Task 8 : Mathematics behind machine learning
This is my favourite task. Being someone who is passionate about mathematics and physics , I felt that this task was made specifically for me . I plotted a table of points in desmos , realised it resembled a parabola , so I made a quadratic regression model . In matlab , I analysed a square wave by implementing fourier transform.

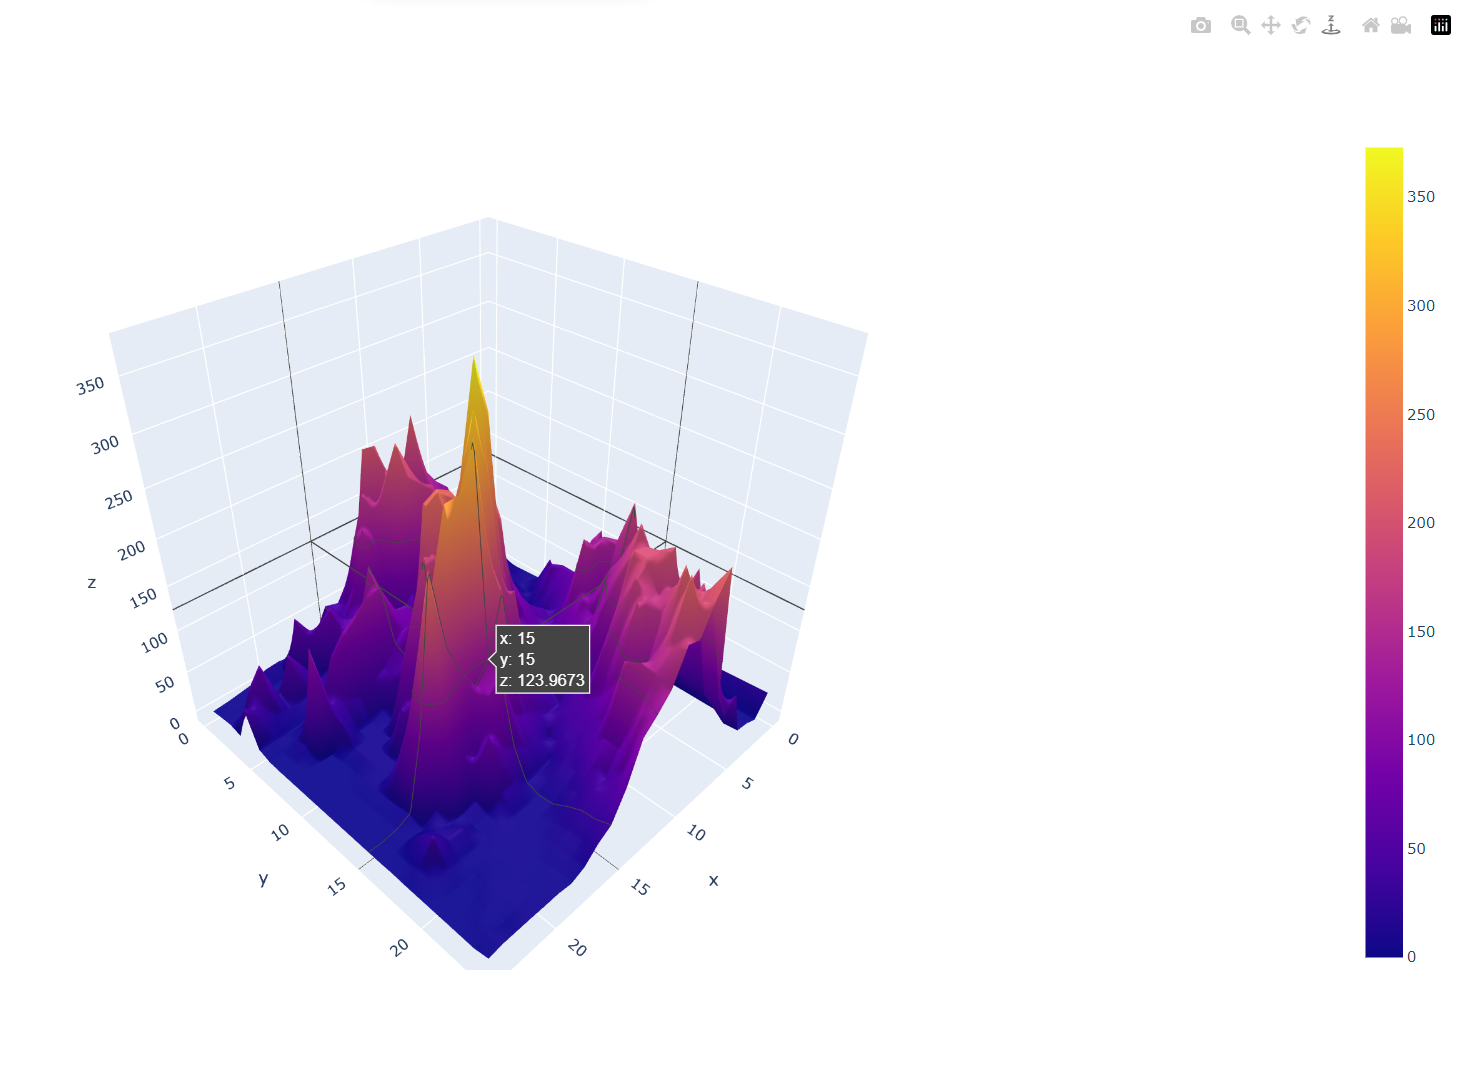
Task 9: Data Visualisation
Learning Plotly was very interesting . At first , I couldn't realise why plotly was needed considering we have matplotlib and seaborn . But while learning it , I realised Plotly is far more interactive and dynamic than either seaborn or matplotlib. I created a 3-D surface plot in plotly on a sample dataset.
Plotly
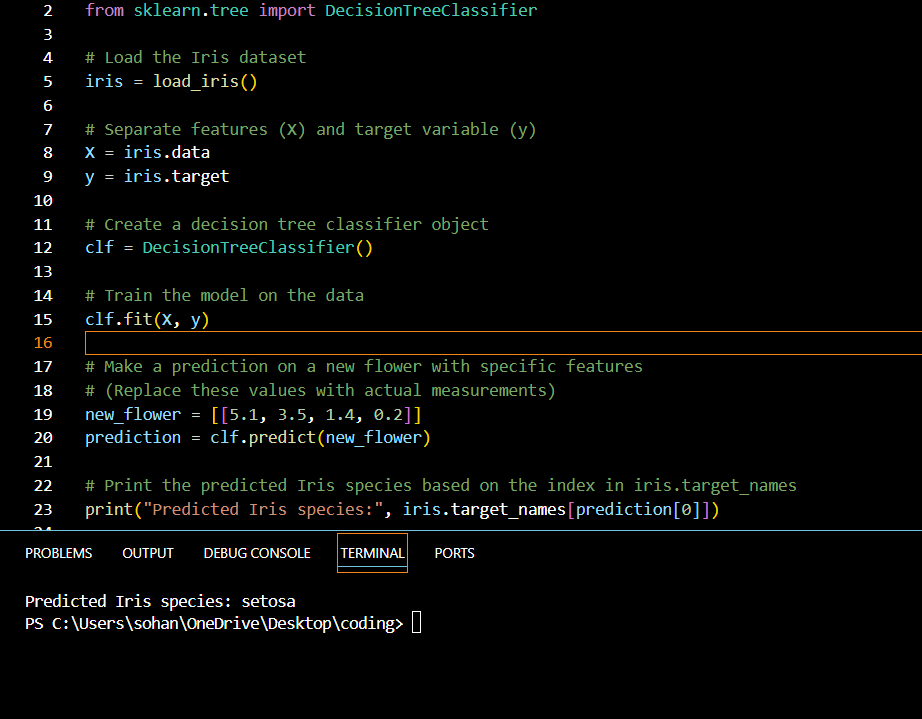
Task 10: Decision Trees
I would say this is my favourite type of machine learning model . I built a decision tree model that classifies the Iris flowers on the basis of their species. Needless to say, this was a very interesting task.
Decision Tree
Task 11: Real World Application of Machine Learning
This offered valuable insight into how models are used in real-time . I used the example of Netflix recommendation engine in my case study , which I exolored in detail and gained a valuable understanding on how it works.
Case Study
This level provided me a valuable foundation in AIML . I'm excited to put my newfound knowledge to use. I would like to thank my co-ordinators Aryan Aithal and Greeshma Sharma for their support, and Marvel UVCE for the learning experience!