
22 / 1 / 2026
TASK 1 : Rules in the Rule Book Written by Blood
Objective : To explore the methodology behind air crash investigations and learn how aviation safety evolves from past incidents.
Task :
- Write a detailed report of the air crash investigation, the report should include:
- Details of the flight, place, time, pilot details and an introductory paragraph about the accident which occurred /was about to occur including the losses occurred.
- Explain in brief about the aircraft.
- Using the Swiss Cheese Model analyze the key contributing factors (technical, human, environmental etc.) and also explain how each of these factors (layers of the Swiss Cheese) accelerated the accident when aligned together.
- State the various theories and assumptions which took place during the investigation and also mention the reasons which led to the elimination/confirmation of these theories.
- Reflect on what lessons were learned and how aviation standards changed post-accident.
Report :
I have reported on crash of American Airlines flight 965, crashed on 20th December 1995.
click here to view my detailed report.
click here to view the official investigation report conducted by National Transportation Safety Board.
TASK 2 : Introduction to MATLAB
Objective :
To gain foundational knowledge of MATLAB and Simulink.
Task :
Complete the MATLAB Onramp course.
Complete the Simulink Onramp course.
Download and upload both certificates as proof of completion.
Outcomes&Learnings :
I have completed the MATLAB Onramp course in which i learned the fundamentals of the MATLab
MATLab Onramp Course :
1. Navigate the MATLAB Desktop and Editor : I have learned to use the interface and write my own scripts to save and run your code.
2. Work with Variables and Arrays: I have learned to perform both element-wise and matrix operations, as well as use built-in functions.
3. Import and Visualize Data: Practiced for bringing data into MATLAB from external files and creating plots to visualize it.
4. Program with MATLAB: Got an introduction to basic programming concepts like logical arrays, conditional statements, and for loops to write more complex programs.
5. Use MATLAB Documentation: I have learned how to find information and help within MATLAB's comprehensive documentation.
6. Complete a Final Project: Analyzing light from a star to determine its motion.
Certificate :

TASK 3 : Autonomous Flight Planning & Execution
Objective :
To understand and practice autonomous flight mission planning using Mission Planner and the ArduPilot simulator.
Task :
1.To learn about the Heads Up Display (HUD)available in the Mission Planner.
Software in the loop (SITL)
Software in the loop is a method of testing and validation of the code in the simulation environment.
SIL has many features that make it advantageous for testing in the automotive industry:
- SIL simulations can be run on any standard desktop computer without requiring the special equipment or test benches needed for HIL testing. This makes it cost-effective to deploy SIL testing across many instances, which reduces testing bottlenecks and speeds up the development process.
- Because the simulation is being performed entirely in software, the testing can actually go faster than it would in real time.
- Simulation programs deliver flexibility and repeatability. Testers run multiple simulations, adjusting for a single variable while all other aspects of the scenario remain constant, creating a more effective feedback loop with software developers.
- SIL helps decouple software and hardware development, allowing software developers to create new features and functions at their own accelerated pace.
- Organizations can test pieces of code or components of a complex solution as they are being developed rather than waiting for the entire product to be finished.
- With multithreading, multiple tests can be conducted at the same time rather than sequentially, which also saves time and improves efficiency.
- The simulations developed for SIL can be reused on HIL tests to monitor physical hardware performance and cross-correlations.
- The results can be easily shared across development teams from technology providers, OEMs and third parties.
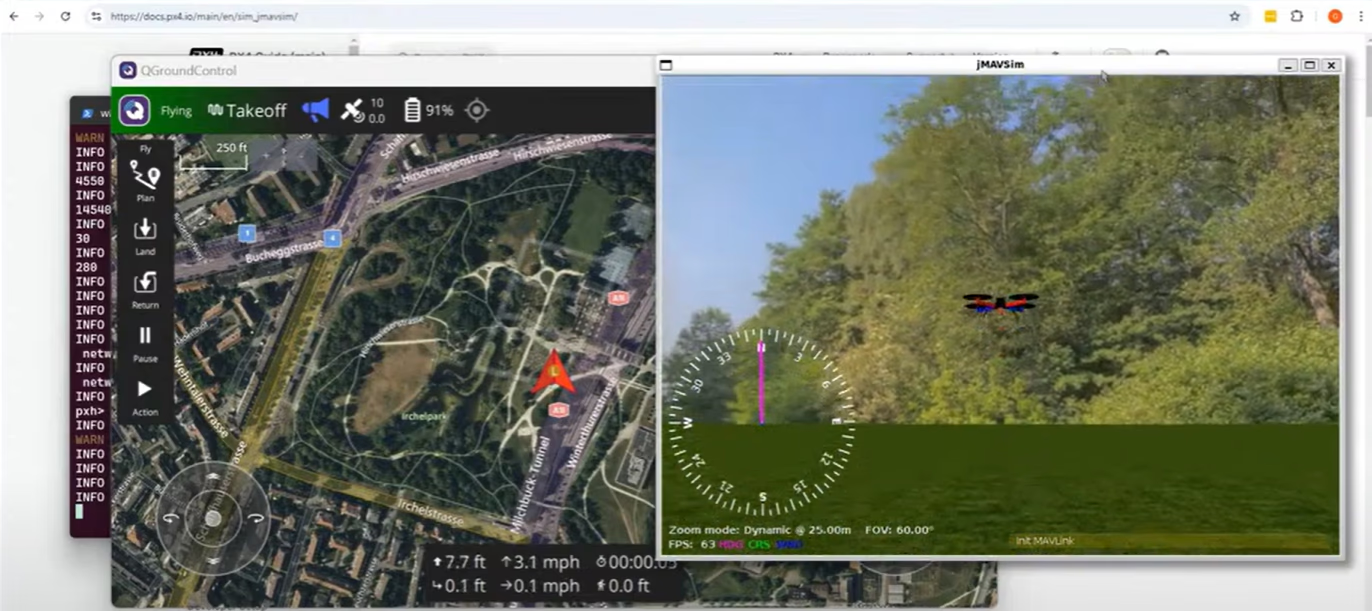
Heads Up Display (HUD)
The Heads-Up Display (HUD) in Mission Planner is a critical component of the ground control station software, providing real-time flight data and situational awareness for operators of unmanned aerial vehicles (UAVs), rovers, and other robotic vehicles.
 1.Airspeed (Groundspeed if no airspeed sensor is fitted)
2.Crosstrack error and turn rate (T)
3.Heading direction
4.Bank angle
5.Telemetry connection link quality (averaged percentage of good packets)
6.GPS time
7.Altitude (Blue bar is the rate of climb)
8.Airspeed
9.Groundspeed
10.Battery status
11.Artificial Horizon
12.Aircraft Attitude
13.GPS Status
14.Distance to Waypoint > Current Waypoint Number
15.Current Flight Mode
Geofence
The virtual boundary that restrict the vehicle from flying into unsafe or restricted zone.
Types of Geofence
1.Cylindrical Fence : Circular boundary to restrict the vehicle.
2.Polygonal Fence : Linear boundary that is useful to fly a vehicle into desired area and shape.

click here to view video of performing the virtual mission.
Saving Mission in Mission Planner
We can make a plan in mission planner in plan window and save in the floders and we can open it any time by clicking Load WP file

Surveying
Surveying is feature of mission planner in which the vehicle captures the photo and video of the area.

click here to watch the video of surveying in mission planner
Advance Flight Planning
Survey on multiple location
Simultaneous survey over the two separate grids

Loiter
Loiter is drone flight mode that uses the GPS to hold the drone's current position, altitude, and heading, by stopping it in the mid air.
TASK 4 : Flight Data Logging & Analysis
Objective : To explore the methodology behind air crash investigations and learn how aviation safety evolves from past incidents.
Task :
LOGS
Logs are recording's of flight data.
There are two types of log analysis they are :
- Telemetry Logs : Requires a real time connection to computer.
- Data flash Logs : On flight controller during flight.
Some Data flash log have internal memory and some of them require an removable SD card.
DATA FLASH LOGS
We can excess the DATA FLASH LOGS in mission planner in flight data tab under the HUD(Heads up display)

- On clicking download data flash logs it shows the option to download the recording's of the previous flights.
- Auto Analysis option enables mission planner to analyze and summary will be provided after analysis.
This is one of Auto analyzed data of my flight
- Review a log option enables us to provide information about the actual path and what went wrong in case of crash and plot graphs.
SIMULATOR LOG FILES
Auto Analysis

Altitude vs Time
 The pink shade shows the drone is in the stable mode i.e. disarmed condition and red color pop-up message (drone is in the auto mode) i.e. armed mode. The drone followed the path which was fed in the FC(flight controller) and reached a peak of 150 m.
Throttle vs Time
 The maximum throttle is 0.48, when the drone reached to it's maximum altitude.
Battery Consumption vs Time
 The current started draining after the drone is armed and started flying.
Battery Voltage vs Time
 The drone consumes 12.6 v through out the flight.
Velocity vs Time
 The peak velocity is 10 m/s and dropped consequently.
CRASH LOG FILES
Auto Analysis

Compass Calibration - fail, means the drone operation is not done properly.
Altitude vs Time
 Calibration is not done properly in the FC(flight controller).
Throttle & Battery vs Time
Due to faulty calibration the throttle and battery is not obtained in the log files.
Velocity vs time
Due to faulty calibration the velocity data has not been recorded in the log files.
AMS LOG FILES
Auto Analysis

Altitude vs Time

 Difference Between the CTUN.Alt and AHRS.Alt
| Aspect | CTUN Altitude | AHRS Altitude |
|---|---|---|
| Definition | The vehicle's most accurate and dynamic estimate of its altitude, calculated by the Extended Kalman Filter (EKF). | The altitude component of the AHRS is primarily based on the barometer, which measures air pressure. |
| Sensor Data Used | The EKF fuses data from multiple sensors, including the Inertial Measurement Unit (IMU), Global Positioning System (GPS), and the barometer. | Based mainly on the onboard barometer. |
| Purpose/Usage | Used internally by the autopilot for all altitude-controlled flight modes, such as AltHold, Loiter, and Auto. For instance, in AltHold, the autopilot compares CTUN.Alt with CTUN.DAlt to adjust throttle and maintain altitude. | In older firmware versions or when the EKF is not functioning properly, the system may rely more heavily on the barometer for altitude estimation. |
Throttle vs Time Consumption

- Bat.volt monitors the performance of the battery.
- CurrTot - Total current consumed over a time.
- Throttle Hover(Tho) : Actual throttle required by the drone to hover.
Battery voltage vs Time

Velocity vs Time
 click here to see my continued report