LEVEL-2:REPORT
2 / 10 / 2024
Task1: Linear and Logistic Regression - HelloWorld for AIML
Linear regression-
It is a statistical method used to model the relationship between a dependent variable (often called the target or outcome) and one or more independent variables (also called predictors or features). Using the Linear Regression class from the scikit learn library, I predicted the house prices of the California dataset. https://github.com/sadhanathanga/Level-2.1/blob/main/Linear_Regression.model.ipynb
Logistic Regression -
Logistic regression estimates the probability of an event occurring. It provides a binary output, that is, 0 or 1.
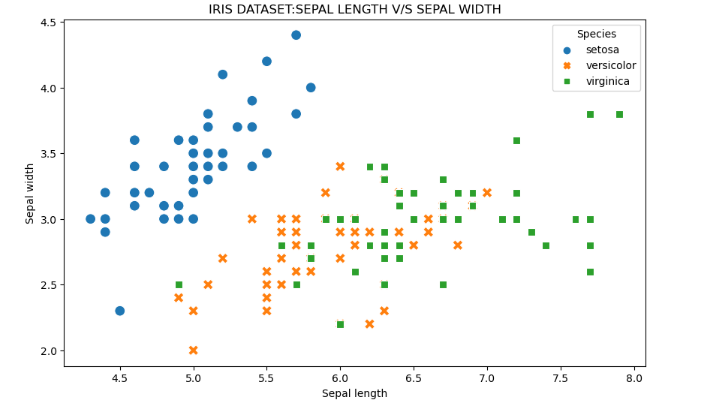
The data tells that there are 3 different species of iris
Setosa: represented by 0
versicolor: represented by 1
virginica: represented by 2
Predicted the species of the flower using the sepal width and length and petal width and length.
Here is the code: https://github.com/sadhanathanga/Level-2.1/blob/main/logistic_regression.ipynb
Task 2:Matplotlib and Data Visualization
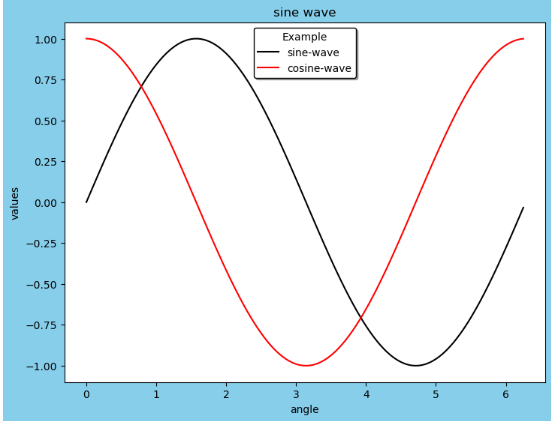
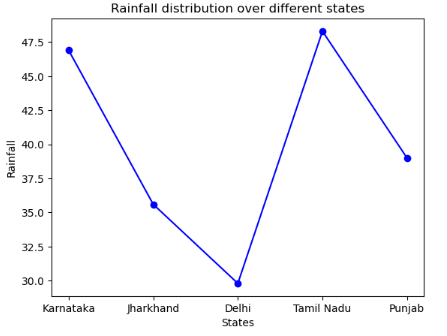
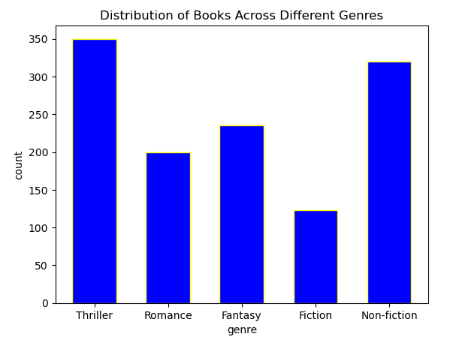
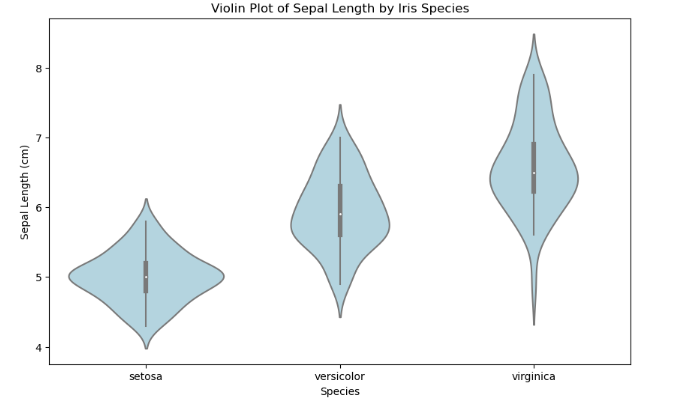
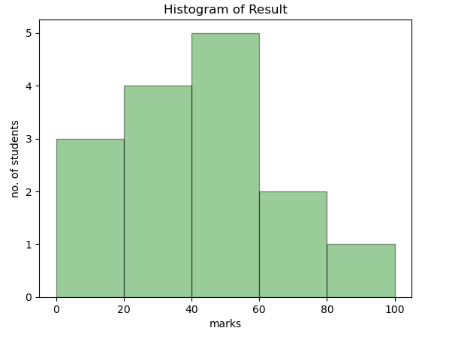
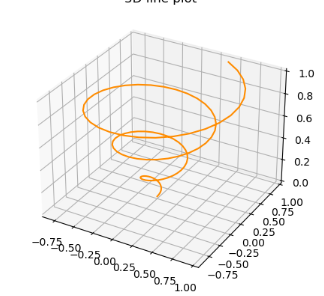
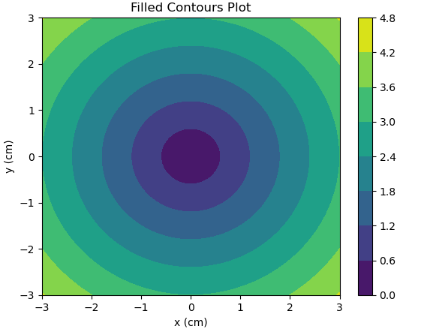
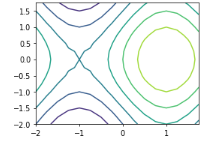
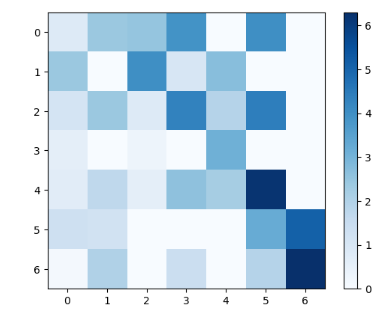
Matplotlib is the plotting library in python where users will be able to create a large number of static, interactive, and animated plots
Stacked Bar graph:
Task 3: Numpy
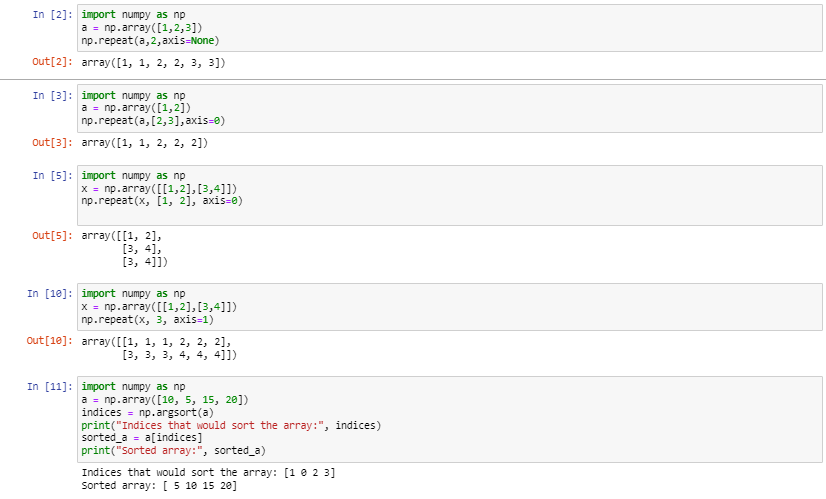
Numpy is a library in python that is used to perform various numerical and mathematical operations on arrays. A feature of NumPy used here is the repeat function. Using the np.repeat function elements of the array can be repeated along different axises.
Task 4: Metrics and Performance Evaluation
To evaluate the performance or quality of the model, different metrics are used, and these metrics are known as performance metrics or evaluation metrics. Regression metrics are supervised machine learning models . Regression models have continuous output. In order to evaluate Regression models, we’ll use these metrics:
MSE - Mean Squared Error:

MAE - Mean Absolute Error:
R² Coefficient of determination-

Here is the code: https://github.com/sadhanathanga/Level2.4/blob/main/Regression_metrics.ipynb Classification Metrics – They are used to evaluate performance of classification algorithms. In machine learning, classification is the process of categorizing a given set of data into different categories. For classification we make use of a confusion matrix. It is a mean of displaying the number of accurate and inaccurate instances based on the model’s predictions. he matrix displays the number of instances produced by the model on the test data. True positives (TP): occur when the model accurately predicts a positive data point. True negatives (TN): occur when the model accurately predicts a negative data point. False positives (FP): occur when the model predicts a positive data point incorrectly. False negatives (FN): occur when the model predicts a negative data point incorrectly.
Task 5: Linear and Logistic Regression - Coding the model from SCRATCH
Linear Regression: The main aim of linear-regression is to find the best fit line, which is represented in the form of a Linear equation as y = mx+b. y= y-coordinate m = slope b = intercept x = x-coordinate The commonly used loss function in Logistic regression is Mean Squared Error(MSE). Here is the code: https://github.com/sadhanathanga/Marvel-2.5/blob/main/linear_regression%20from%20scratch.ipynb
Logistic Regression:
It is mainly used in case of binary classification problems, where the output is discrete( 0 or 1).
It is based on the sigmoid or the logistic function, which is given as:

Here is the code: https://github.com/sadhanathanga/Marvel-2.5/blob/main/Logistic_Regression%20from%20Scratch.ipynb
Task 6: K Nearest Neighbours
K-Nearest Neighbors (KNN) is a simple machine learning algorithm used for classification and regression. It works by looking at the data points around a new data point to make predictions. K is the parameter we use to refer to the number of nearest neighbours we must be considering In the voting process. KNN calculates the distance between the between the qwery point and Other data points in the training set. The distance measured is usually the Euclidean distance. Then it identifies the K nearest neighbors to the new instance. Here is the code- https://github.com/sadhanathanga/Marvel-2.6/blob/main/Knn.ipynb
Task 7: An elementary step towards understanding Neural Network
Neural Networks are computational models that mimic the complex functions of the human brain.
The neural networks consist of interconnected nodes or neurons that process and learn from data,
enabling tasks such as pattern recognition and decision making in machine learning. They are mainly
used in image and speed recognition. They are mainly of two types: ANN (Artificial Neural Network)
and CNN(Convolutional Neural Network).
Here is the blog: https://github.com/sadhanathanga/Marvel-2.7/blob/main/Neural_Networks.md
LLM: A large language model is a type of artificial intelligence algorithm that applies neural network techniques with lots of parameters to process and understand human languages or text using self-supervised learning techniques. Tasks like text generation, machine translation, summary writing, image generation from texts.
Here is the blog: https://github.com/sadhanathanga/Marvel-2.7/blob/main/GPT-4.md
Task 8: Mathematics behind machine learning
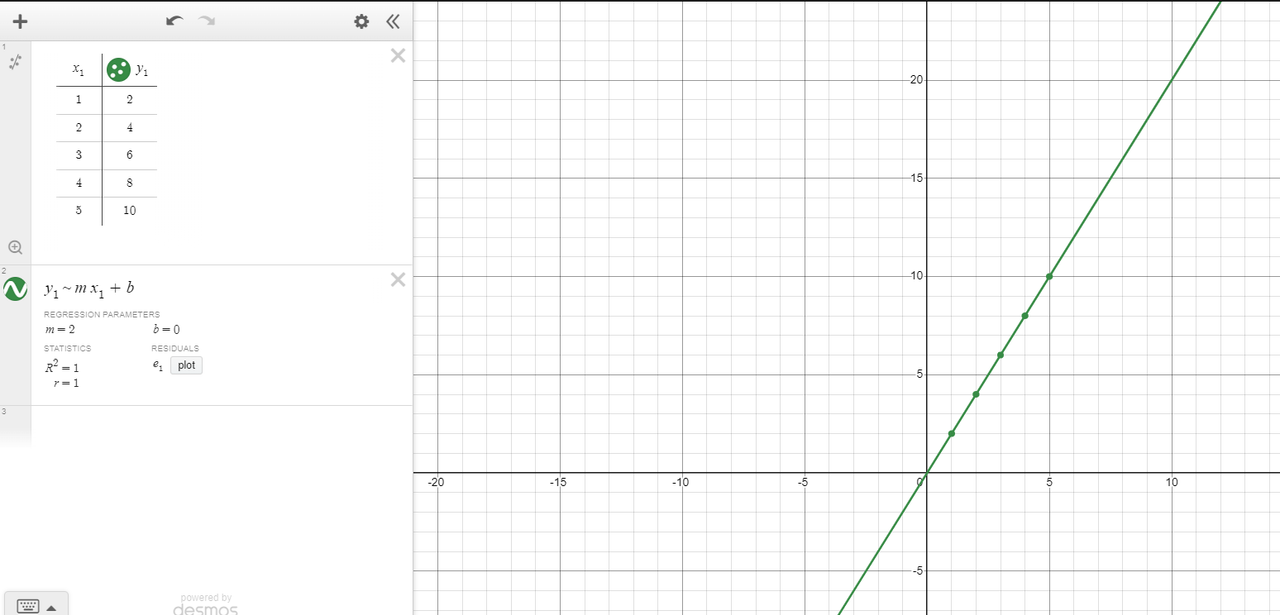
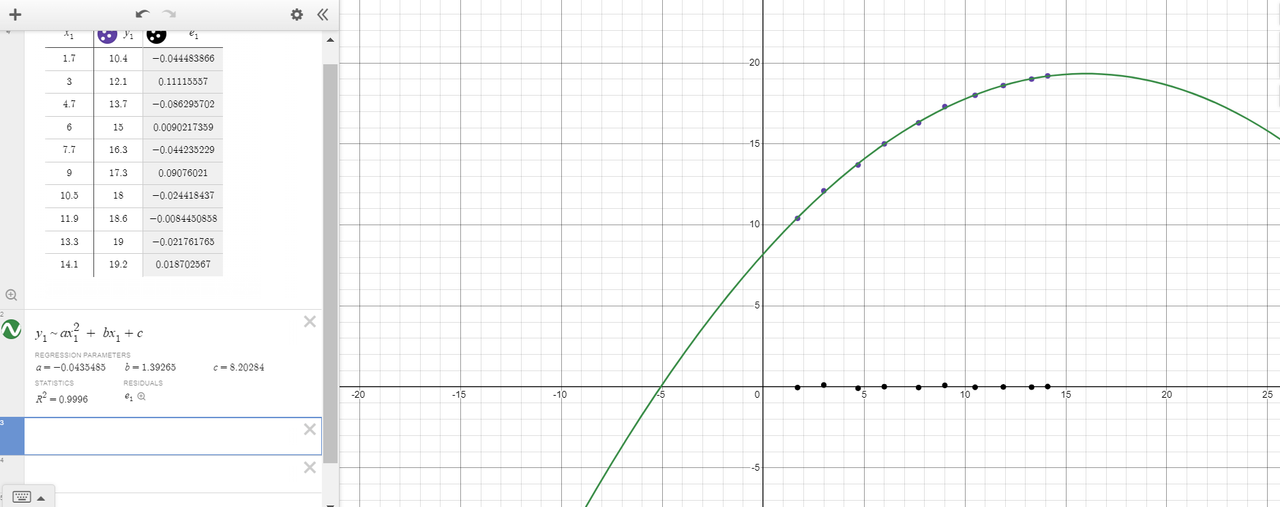
Curve-Fitting: Curve fitting is the process of constructing a curve, or mathematical function, that has the best fit to a series of data points.
Fourier Transform :
Fourier Transform is a mathematical model which helps to transform the signals between two different domains, such as transforming signal from frequency domain to time domain or vice versa. Their applications range from digital music to quantum mechanics. Here is the code: https://github.com/sadhanathanga/Marvel-2.8
Task 9: Data Visualization for Exploratory Data Analysis
Plotly library in Python is an open-source library that can be used for data visualization and understanding data simply and easily. Plotly supports various types of plots like line charts, scatter plots, histograms, box plots, etc. Here is the code: https://github.com/sadhanathanga/Marvel-2.9/blob/main/plotly.graphs.ipynb
Task 10: An introduction to Decision Trees
Decision tree comes under supervised machine-learning and is used for both Classification as well as regression. Root node represents the main dataset, internal nodes are where the decisions are made, branches represent the possible outcomes, leaf nodes represent final decisions. I built a model using decision trees to predict whether a individual survived the titanic ship-wreck based on his age, fare and class. Here is the code: https://github.com/sadhanathanga/Level-2.5/blob/main/Decision.tree.ipynb
Task 11: SVM
I have completed a task on support vector machines (SVMs), which are a type of supervised learning method. SVMs create a model to classify data into two categories by finding the best dividing line, called a hyperplane, that maximizes the gap between the two classes. The goal is to ensure that the data points are as far apart as possible while managing any errors in classification. Here is the code: https://github.com/sadhanathanga/Marvel-2.11

