COURSEWORK
Shreya's AI-ML-001 course work. Lv 3
| Shreya Nayak | AUTHOR | ACTIVE |

25 / 10 / 2024
TASK 2: API
An API (Application Programming Interface) acts as a bridge between different software systems, allowing them to interact and share data seamlessly. It specifies how requests should be made and what responses will look like, making it easier for developers to incorporate external services and features into their applications. By providing a structured way for programs to communicate, APIs simplify the integration process and expand the functionality of software without requiring deep knowledge of the other system's internal workings.
Building a Weather App using Open Weather API
Steps to Create a Weather App Using Open Weather API
-
Create an HTML File for the Content
- Design the HTML structure of the page that will display the weather information.
- Include sections for displaying the city name, temperature, weather description, etc.
-
Style the Page Using CSS
- Use CSS to add basic styling to the page. This can include:
- A background color or image.
- Font styles for headings and weather data.
- Proper layout with flexbox or grid for responsive design.
- Use CSS to add basic styling to the page. This can include:
-
Visit Open Weather API and Access the Documentation
- Go to the Open Weather API website.
- Click on the "Current Weather Data" documentation.
- Familiarize yourself with how to call the API using a city name, coordinates, or other parameters.
-
Fetch the API Data Using JavaScript
- In the JavaScript file, use the
fetchcommand to make an API call. Example:
- In the JavaScript file, use the
-
Create a Function to Handle the API Response
- Write a function that will be triggered when the API call executes successfully. This function should:
- Extract and display the relevant weather data (temperature, humidity, description, etc.).
- Dynamically update the HTML to show the fetched data.
- Write a function that will be triggered when the API call executes successfully. This function should:
-
Handle Errors
- Ensure to include error handling in case the API request fails.
- Display appropriate messages to the user if the data is unavailable.
You can check out the weather app at the following link:
Weather App Link
The code for the weather app can be found in the GitHub repository:
GitHub Repository Link
TASK 3: Working with GitHub
-
Forked the Repository
- Forked the repository into my own GitHub account.
-
Cloned the Repository
- Created a new folder on my local machine.
- Cloned the forked repository into this new folder using:
git clone
-
Made Changes
- Made the required changes to the code or files.
-
Added and Committed the Changes
- Staged the changes using:
git add . - Committed the changes with a descriptive message:
git commit -m "Descriptive commit message"
- Staged the changes using:
-
Pushed the Changes
- Pushed the changes back to the forked repository on GitHub:
git push origin main
- Pushed the changes back to the forked repository on GitHub:
-
Created a Pull Request
- Opened a pull request from the forked repository to the original repository for review and potential merge.
TASK 5: Kaggle Contest
Steps:
-
Import Libraries
- Import NumPy to perform numerical operations and Pandas to manipulate the data and read CSV files.
-
Read the Datasets
- Read the
train.csvdataset intotrain_dataand thetest.csvdataset intotest_data.
- Read the
-
Check the Survival Rate of Women
- Calculate the rate of women who survived.
-
Check the Survival Rate of Men
- Similarly, calculate the rate of men who survived.
-
Train the Model
- Train the model using a RandomForestClassifier from scikit-learn.
-
Make Predictions and Write to a DataFrame
- Make predictions on the test dataset and write the results into a DataFrame.
TASK 6: Working with Pandas and Matplotlib
Pandas is a Python library for data manipulation and analysis, providing data structures like DataFrames for handling complex datasets. Matplotlib is a library for creating visualizations, allowing users to generate various types of plots and charts to represent data effectively. Together, they offer powerful tools for analyzing and visualizing data in Python.
Libraries Used
- NumPy: To handle numerical data and perform fast mathematical operations on numerical data.
- Pandas: For data manipulation and analysis, including reading data from CSV files.
- Matplotlib: For data visualization.
Graphs
You can access the code for the Pandas and Matplotlib project at the following link:
GitHub Repository Link
TASK 7: Create a Portfolio Webpage
Portfolio Webpage
You can view my portfolio webpage at the following link:
Portfolio Link
Code Repository
The code for my portfolio can be found in the GitHub repository:
GitHub Repository Link
TASK 8: Resource Article Using Markdown
Code Repository
The code for my portfolio can be found in the GitHub repository:
GitHub Repository Link
TASK 9: Tinkercad - Ultrasonic Sensor Using Servo
Tinkercad Project
To create a radar system using Tinkercad, start by setting up an account and familiarizing yourself with the platform and its example circuits. In your project, you’ll use an ultrasonic sensor to measure the distance of nearby objects by emitting sound waves and calculating the time they take to return. The servo motor will be connected to rotate the sensor, allowing it to cover a wider detection range. As the servo rotates, the ultrasonic sensor will scan the area, and the detected distances can be displayed on the serial monitor, simulating a basic radar system capable of identifying obstacles within its range.
You can view my Tinkercad project at the following link:
Tinkercad Project Link
TASK 10: Speed Control of DC Motor
Tinkercad Project
Explore the basics of controlling DC motors using an Arduino UNO and L298N motor driver. The L298N driver acts as an H-Bridge, allowing control over the direction and speed of a 5V BO motor through PWM signals from the Arduino. First, simulate this setup on Tinkercad by connecting the motor and driver, then upload the control code. Once successful, perform the same on actual hardware and record videos to document both the simulation and hardware execution.
You can view my Tinkercad project at the following link:
Tinkercad Project Link
TASK 14: Karnaugh Maps and deriving logic circuit
Alarm System Logic
-
Door Status
- Open: Indicated by 1
- Closed: Indicated by 0
-
Key Status
- Found: Indicated by 1
- Not Found: Indicated by 0
-
Alarm Trigger Condition
- The alarm is triggered based on the combination of the door and key status:
- If the door is open (1) and the key is not found (0), the alarm is triggered.
- If the door is closed (0), the alarm is not triggered regardless of the key status.
- If the door is open (1) and the key is found (1), the alarm is not triggered.
- The alarm is triggered based on the combination of the door and key status:
Working of the Intrusion Detection System
-
Photoresistor Functionality
- When an intruder causes a change in light level, the resistance of the photoresistor changes.
- This change alters the voltage at the junction.
-
AND Gate Detection
- The change in voltage is detected by the AND gate.
- If the system is armed, the AND gate will output a high signal.
-
Alarm Activation
- The high signal from the AND gate triggers the following:
- Lights up the LED.
- Sounds the piezo buzzer.
- This indicates an intrusion.
- The high signal from the AND gate triggers the following:
You can view my Tinkercad project for the burglar alarm at the following link:
Tinkercad Project Link
TASK 15: Active Participation
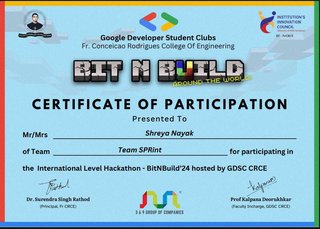
- Participated in BitNBuild conducted by GDSC UVCE.


