
COURSEWORK
Parthjit's EV-RE-001 course work. Lv 1
| Parthjit singh | AUTHOR | ACTIVE |
23 / 2 / 2025
TASK 1: Active Participation
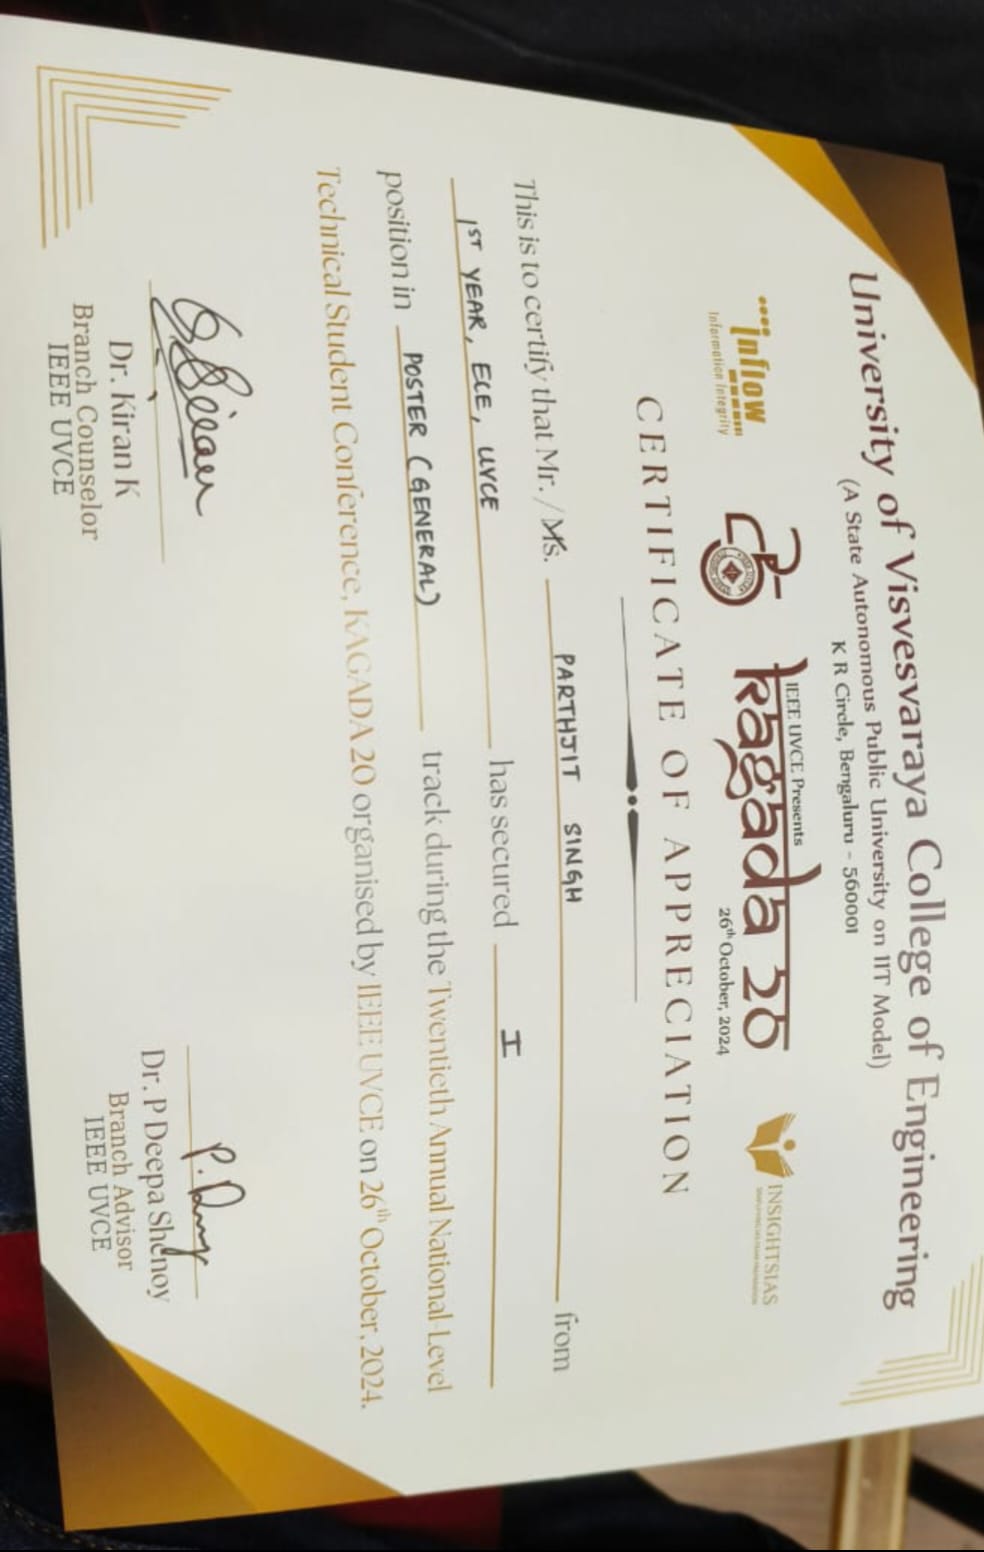
I secured 1st place in the Kagada 2023 Project Making Competition with my innovative project. It focused on harnessing heat energy from railway tracks and converting it into electricity using Thermoelectric Generators (TEGs), which operate based on the Seebeck effect. Below, you can see the certificate I received for this achievement.
TASK 2: Datasheets report writing
- The L293D is a dual-channel H-Bridge motor driver IC designed to control two DC motors or one stepper motor. It allows independent control of up to two motors, making it a great choice for two-wheeled robotic platforms. While commonly used for motor control, it can also handle other inductive loads like relay solenoids or large switching power transistors. The IC supports configurations such as four solenoids, four unidirectional DC motors, two bidirectional DC motors, or one stepper motor.
It features built-in kick-back diodes to protect the circuit when the motor is de-energized. With an operating voltage range of 4.5V to 36V and a peak output current of 1.2A per channel, the L293D is compatible with a wide variety of motors.
Key Specifications:
- Motor output voltage: 4.5V - 36V
- Logic input voltage: 5V
- Output current per channel: 600mA
- Peak output current per channel: 1.2A
Below is an image showing the pin configuration of the L293D.
2. PWM -- to control speed:
The speed of a DC motor can be controlled by changing its input voltage. A common technique to do this is to use PWM (Pulse Width Modulation). PWM is a technique where the average value of the input voltage is adjusted by sending a series of ON-OFF pulses. The average voltage is proportional to the width of the pulses known as the Duty Cycle. The average voltage is proportional to the width of the pulses known as the Duty Cycle.
- H-Bridge -- to control the rotation direction:
The spinning direction of a DC motor can be controlled by changing the polarity of its input voltage. A common technique for doing this is to use an H-bridge. An H-bridge circuit consists of four switches with the motor in the centre forming an H-like arrangement. Closing two specific switches at a time reverses the polarity of the voltage applied to the motor. This causes a change in the spinning direction of the motor.

TASK 3: K-Map & Deriving Logic Gates
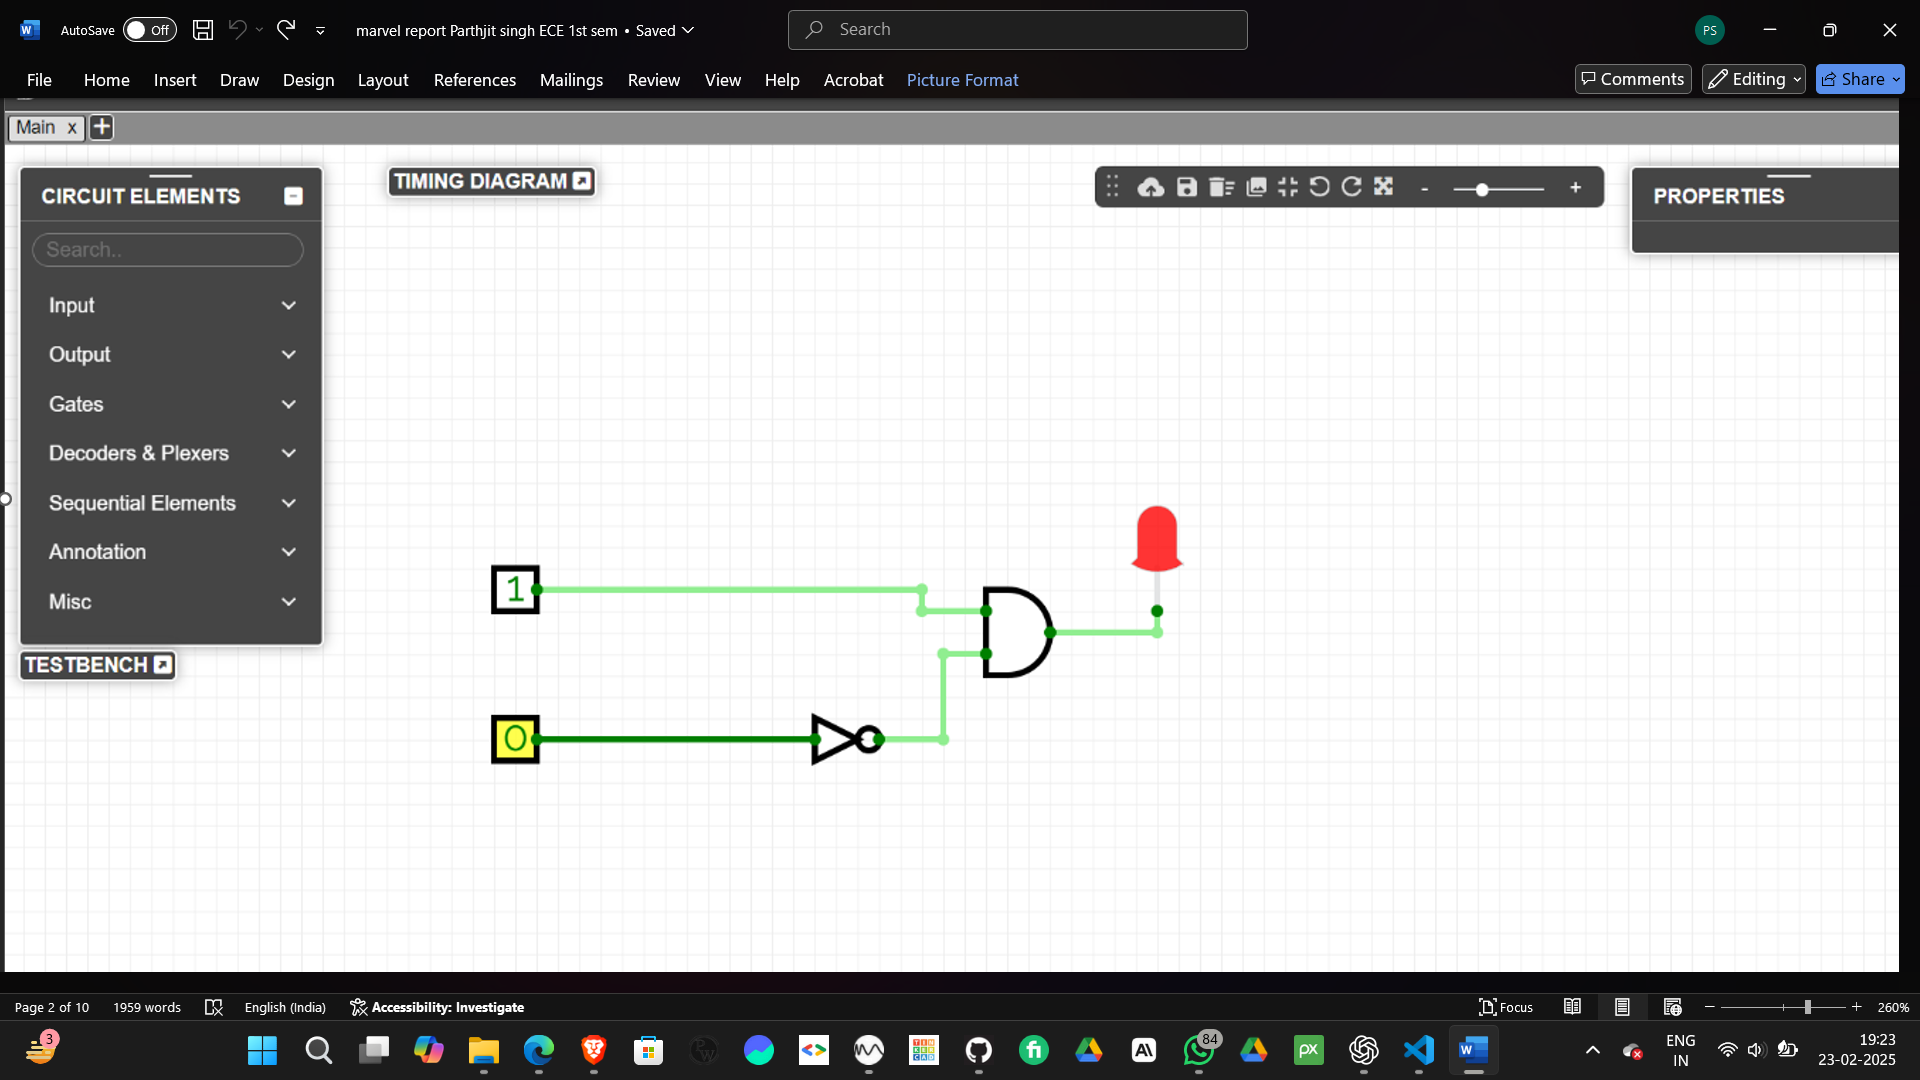
Objective: Design a burglar alarm using simple logic circuits and determine its Karnaugh map. The alarm, represented by a buzzer or LED, activates when specific conditions are met. Push buttons can simulate the door and key states.
Methodology: The burglar alarm should trigger in the event of unauthorized access, specifically when the door is opened without the key. To achieve this, the following assumptions are made:
-
Door (D):
- Open door = 1
- Closed door = 0
-
Key (K):
- Key not inserted = 0
- Key inserted = 1
-
Alarm (A):
- Alarm activated = 1
- Alarm off = 0
The alarm logic is determined using a truth table that maps the states of the door (D) and key (K) to the alarm (A). This truth table will serve as the foundation for creating the Karnaugh map and the logic circuit.
TASK 4: Speed control of DC motor using L293D driver:
.png)
Link to my work: https://www.tinkercad.com/things/cCqGqtcsiD1-copy-of-for-loop-iteration
Objective: Understand the control DC motors using the L298N motor driver and the Arduino board. Using an UNO and H-Bridge L298N motor driver, control the speed of a 5V motor.
Methodology:
For this project we'll need the below components:
The connections are made as follows
L293D motor driver
| Component | Connection |
|---|---|
| Power 1 | 5v |
| Enable 1 &2 | 5v |
| Input 1 | Pin 13 |
| Output1 | Terminal 2 dc motor |
| Ground | GND |
| Output2 | Terminal 1 dc motor |
| Input 2 | Pin 12 |
| Power 2 | Wiper of potentiometer |
I learned about the various ports and pins present in the L293D motor driver.
2. Speed Controlling using an L298D driver:
The speed of a DC motor can be controlled by changing its input voltage. A widely used technique to accomplish this is Pulse Width Modulation (PWM). PWM is a technique in which the average value of the input voltage is adjusted by sending a series of ON-OFF pulses. This average voltage is proportional to the width of the pulses, which is referred to as the Duty Cycle. The higher the duty cycle, the higher the average voltage applied to the DC motor, resulting in an increase in motor speed. The shorter the duty cycle, the lower the average voltage applied to the DC motor, resulting in a decrease in motor speed.
TASK 5: API
An API (Application Programming Interface) is a set of rules, protocols, and tools that allows different software applications to communicate with each other. It acts as a bridge between different systems, enabling them to exchange data and functionality in a standardized way.
The Python-based weather application uses Tkinter for the graphical user interface (GUI) and the OpenWeatherMap API to fetch real-time weather data. Users can input a city name to retrieve weather details such as temperature, description, and a representative weather icon.
Key features include a user-friendly interface with an entry field for city input, real-time updates of weather details, and error handling for invalid city names. The application utilizes libraries like Tkinter for GUI, Requests for API interaction, Pillow for displaying weather icons, and ttkbootstrap for enhanced theming. The workflow involves user input, API interaction to fetch weather data, and dynamic updating of the GUI with results.
Strengths of the application include its simplicity, dynamic content updates, and effective error handling. However, limitations include the exposure of the API key, lack of advanced features like forecasts, and dependency on an active internet connection.
Future improvements could include adding forecasts, enhancing security by storing the API key securely, introducing offline functionality, supporting multiple languages, and improving UI adaptability.
to see my work click here
Overall, the application is a practical and beginner-friendly demonstration of GUI programming and API integration, with potential for further enhancements.
TASK 6: Writing Resource Article using Markdown
The Hubble Space Telescope (HST) is a groundbreaking space-based observatory launched on April 24, 1990, by NASA in collaboration with the European Space Agency (ESA). Named after the renowned astronomer Edwin Hubble, it orbits Earth at an altitude of about 547 kilometers (340 miles), avoiding atmospheric distortions that hinder ground-based telescopes.
The Hubble Space Telescope: A Window to the Universe

The Hubble Space Telescope (HST), launched on April 24, 1990, represents a monumental achievement in human curiosity and technological innovation. Orbiting Earth at an altitude of approximately 547 kilometers (340 miles), Hubble has provided humanity with unprecedented views of the cosmos, fundamentally transforming our understanding of the universe.
Design and Technology Hubble is a Cassegrain reflector telescope, equipped with a 2.4-meter (7.9-foot) primary mirror. Its design allows it to capture light across ultraviolet, visible, and near-infrared wavelengths, making it a versatile tool for exploring a variety of cosmic phenomena.
Key scientific instruments onboard Hubble include:
Wide Field Camera 3 (WFC3): Captures high-resolution images in ultraviolet, visible, and near-infrared light
Cosmic Origins Spectrograph (COS): Studies the large-scale structure of the universe and the formation of galaxies.
Advanced Camera for Surveys (ACS): Optimized for wide-field imaging and faint object detection.
Space Telescope Imaging Spectrograph (STIS): Combines imaging and spectroscopy to study celestial objects in detail.
Fine Guidance Sensors (FGS): Critical for precision pointing and astrometry.
Scientific Contributions Hubble's discoveries have profoundly impacted astrophysics and cosmology. Some of its most significant contributions include:
Expanding Universe: Confirmed the accelerating expansion of the universe, leading to the discovery of dark energy.
Star Formation and Death: Provided stunning imagery of star-forming regions, such as the iconic Pillars of Creation in the Eagle Nebula.
Galactic Evolution: Documented galaxies in various stages of development, shedding light on the universe's history.
Deep Field Observations: The Hubble Deep Field and Ultra Deep Field images revealed thousands of galaxies in a single frame, some dating back to the early universe.
Conclusion
The Hubble Space Telescope stands as a testament to human ingenuity, perseverance, and the relentless quest to uncover the mysteries of the cosmos. Even as it nears the end of its mission, its legacy will continue to inspire future generations of scientists, engineers, and dreamers.
TASK 7: Create a Portfolio Webpage
Here is the file for my portfolio webpage
TASK 8: Working with Pandas and Matplotlib:
Pandas and Matplotlib: Easy Tools for Data Work
Pandas
Pandas is a Python library that helps you work with data easily. It has two main ways to organize data:
- Series: For one column of data.
- DataFrame: For tables with rows and columns.
Here's what Pandas can do:
- Fix Data: Handle missing data, filter rows, group data, and combine tables.
- Work with Files: Open and save data in formats like CSV, Excel, JSON, and databases.
- Summarize Data: Quickly calculate totals, averages, or other summaries.
- Time Data: Handle dates and times in your data.
Pandas is perfect for cleaning and organizing data before analyzing it.
Matplotlib
Matplotlib is another Python library, used for creating charts and graphs. It helps you turn numbers into pictures.
Here's what Matplotlib can do:
- Make Graphs: Create line graphs, bar charts, pie charts, and more.
- Customize: Change colors, labels, and add legends to make your graphs clear.
- Work Together: It works well with Pandas and other libraries like NumPy.
- Interactive: Lets you zoom and interact with your graphs using plt.show().
By using Pandas and Matplotlib together, you can organize your data and make it easy to understand with visualizations.
to see my work click here
TASK 9: Kaggle contest
Objective: Exploring Kaggle and Participating in the Titanic ML Competition
The goal was to create a Kaggle account, explore the platform, and participate in the Titanic Machine Learning competition. This competition is an excellent starting point for beginners, as it involves building a machine learning model to predict which passengers survived the Titanic disaster.
Outcomes and Learnings:
-
Getting Started with Kaggle:
I created an account on Kaggle, explored its features, and became familiar with its interface, including competitions, datasets, and notebooks. -
Participating in the Titanic Competition:
I completed the Titanic ML challenge, which required creating a predictive model using machine learning techniques. This task helped me understand the competition workflow on Kaggle. -
Model Development and Submission:
I developed an ML model to predict passenger survival based on the dataset provided. After training and testing the model, I submitted my predictions to the competition leaderboard. -
Performance and Results:
My public score for the competition was 0.77511, placing me at position 7473 on the leaderboard.
.png)
TASK 10: Working with Github:
Objective: Understanding GitHub Workflows and Features
The task focused on gaining hands-on experience with GitHub workflows, including GitHub Actions, Issues, and pull requests. A specific GitHub repository was provided, and the instructions for completing the task were detailed on the MARVEL website. https://github.com/prth96/git
-
Exploring the GitHub Environment:
I became familiar with the GitHub platform, understanding its interface, features, and tools for collaborative development. -
Creating and Managing Repositories:
I learned how to create new repositories, manage their contents, and delete them when no longer needed. -
Contributing to Other Repositories:
I gained experience in making changes to repositories owned by others, collaborating effectively, and pushing updates back to their repositories. -
Forking and Cloning:
I forked the given repository into my own GitHub account and cloned it to my local system. This allowed me to work on the specified tasks locally before pushing the changes