Level 3
29 / 3 / 2025
Task 1 - Decision Tree based ID3 Algorithm
The ID3 Decision Tree Algorithm is a classification algorithm that builds a decision tree by choosing the attribute that provides the highest Information Gain. It follows a greedy approach, recursively selecting the best attribute for partitioning the dataset until an optimal tree is formed.It is prone to Overfitting,cannot handle Continuous Data directly and Biased towards attributes with many values(Gain Ratio solves this).
Steps in ID3
- Calculate Entropy of the Dataset – Measures impurity in the dataset.
H(S)=−∑(i=1,n)(pᵢ * log₂(pᵢ)) - Calculate Information Gain for Each Feature – Determines the effectiveness of an attribute in splitting the data. IG(S,A)=H(S)−H(S∣A)
- Select the Feature with the Highest Information Gain.This becomes the root node.
- Split the Dataset based on the selected feature and repeat the process recursively.
- It is stopped when all examples belong to the same class,no more attributes remain to split or the dataset is empty.
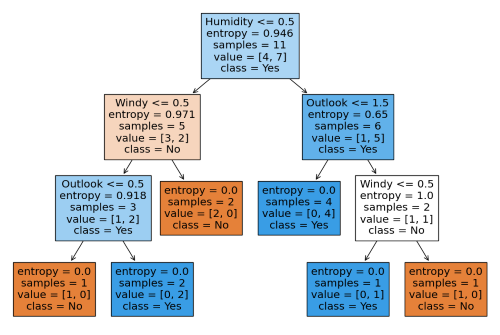
In my Kaggle notebook, I implemented the ID3 (Iterative Dichotomiser 3) algorithm for decision tree classification. The dataset was preprocessed by handling missing values and encoding categorical features.
I used the ID3 algorithm to construct a decision tree by recursively selecting attributes based on Information Gain, ensuring the most informative splits. The tree-building process was visualized to illustrate its hierarchical structure.
To evaluate performance, I tested the model on unseen data and analyzed accuracy. The results demonstrated ID3’s effectiveness in handling categorical data while highlighting its sensitivity to overfitting in deeper trees.
Task 2 - Naive Bayesian Classifier
The Naive Bayes classifier is a probabilistic model based on Bayes' Theorem with an assumption of feature independence.
Equation of Bayes Theorem.P(C|X) = P(X|C) * P(C) / P(X). Types of Naive Bayes -
1.Gaussian Naive Bayes:Assumes features follow a Gaussian (normal) distribution and used for continuous data.
2.Multinomial Naive Bayes:Assumes features follow a multinomial distribution (e.g., word counts) and used for discrete data like text.
3.Bernoulli Naive Bayes:Assumes binary features and used for binary attributes.
Steps in Naive Bayes:
1.Calculate Prior Probabilities:Compute P(C),the probability of each class.
2.Calculate Likelihood:Compute P(X|C) for each feature using probability distribution function(∏ P(xᵢ|C) ).
3.Apply Bayes' Theorem:Compute P(C|X) for each class.
4.Predict Class:Choose the class with the highest posterior probability.
Task 3 - Ensemble techniques
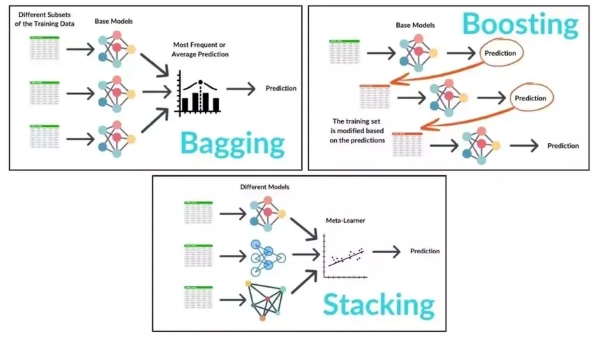
Ensemble learning is a technique that combines multiple models to improve performance, accuracy, and robustness. By aggregating the predictions of several models, ensemble methods can often outperform individual models. The key techniques inlcude:
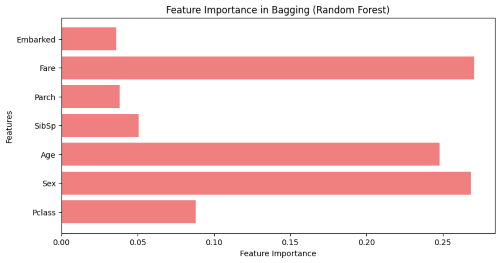
- Bagging-A method to reduce variance by training multiple models on random subsets of data and averaging their predictions.Example: Random Forest.
- Boosting-An iterative technique that focuses on correcting errors by giving more weight to misclassified data points in each subsequent model.Example: AdaBoost, Gradient Boosting, XGBoost.
- Stacking-Combines different models (base learners) and uses a meta-model to combine their predictions, leveraging the strengths of multiple algorithms.
Ensemble
Ensemble techniques helped improve prediction accuracy by combining multiple models. I explored methods like Bagging, Boosting, and Stacking and applied them to the Titanic dataset. After experimenting , I found that Random Forest gave the best results.
Task 4 - Random Forest, GBM and Xgboost
Random Forest:
I successfully understood and applied the Random Forest algorithm to the Titanic dataset with better test performance, handling missing values, feature engineering, and hyperparameter tuning. The model performed well and analyzing feature importance provided key insights.
Gradient Boost Machine:
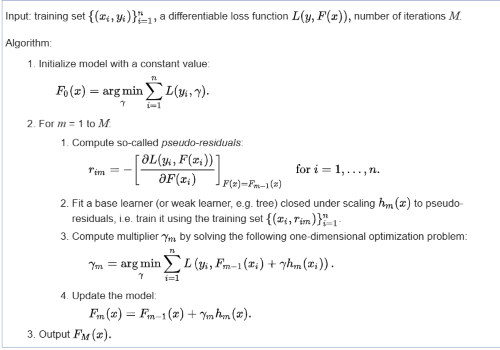
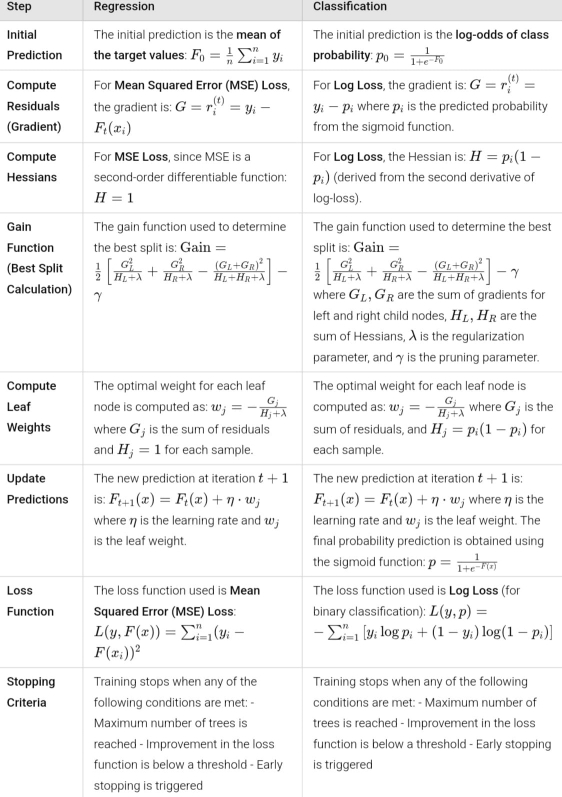
Gradient Boosting Machine (GBM) for Regression:
Gradient Boosting Machine (GBM) for Classification:
1.Initialize Model – Start with an initial prediction minimizing loss, using log-odds for binary classification.
2.Iterate Over M Weak Learners:
- Compute pseudo-residuals using the log loss gradient.
- Train a decision tree to predict pseudo-residuals.
- Compute the scaling factor to control the weak learner’s contribution.
- Update the model: add the new learner with the scaling factor.
3.Final Prediction – After M iterations, classify based on updated probabilities:
y = 1 if p ≥ 0.5, else 0.
XGBOOST (Extreme Gradient Boosting)
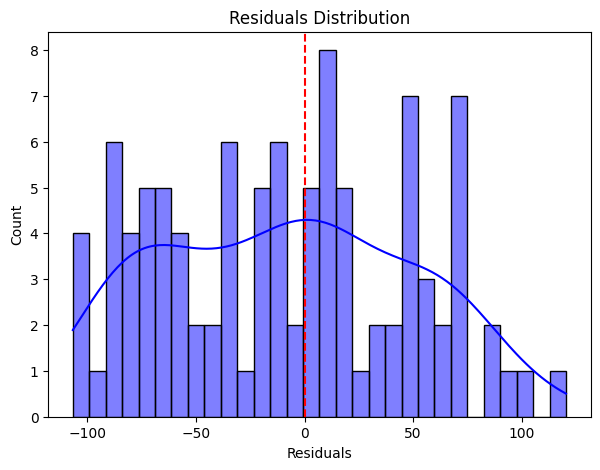
In my Kaggle notebooks XGBoost for Regression and Classification . The regression model predicts target values based on input features, optimizing MSE. The classification model assigns labels using log-odds and the sigmoid function. Both implement gradient and Hessian calculations, decision tree splitting, and leaf weight updates. The House Prices dataset powers regression, while Titanic survival data is used for classification.
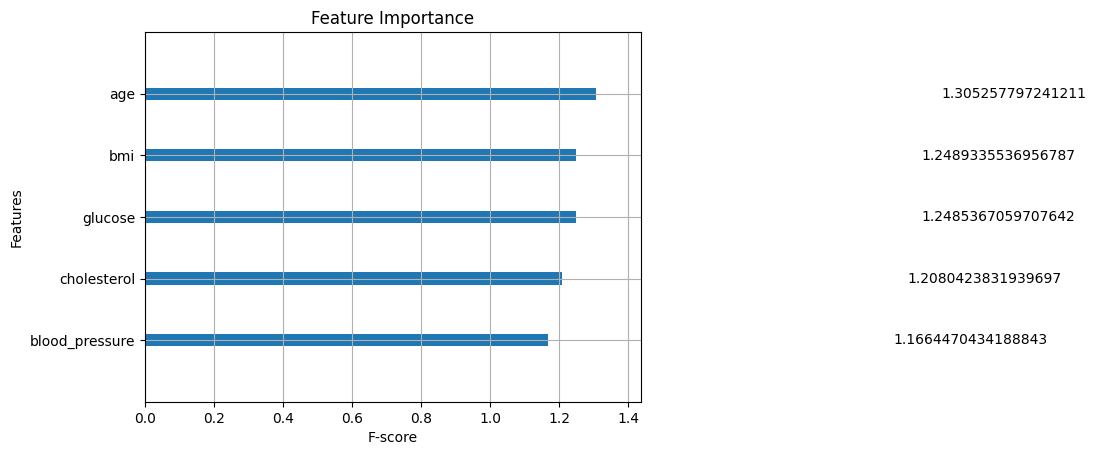
XGB For Classification XGB For Regression
Task 5 - Hyperparameter Tuning
Hyperparameter tuning is the process of selecting the optimal values for a machine learning model’s hyperparameters. They control the learning process itself, rather than being learned from the data.
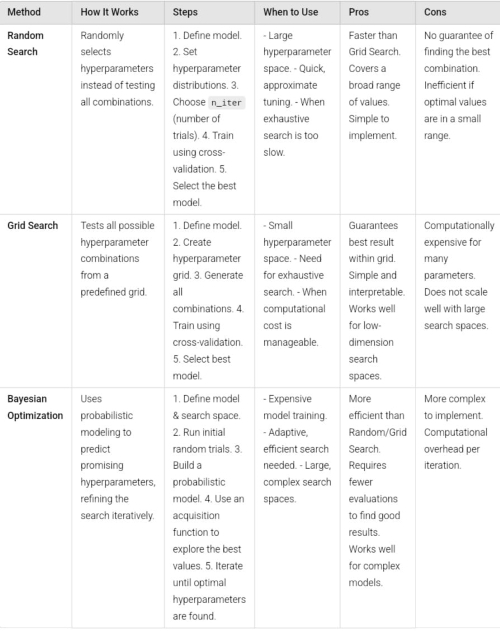
- Random Search – Selects hyperparameters randomly from predefined distributions and evaluates performance. It is effective for large search spaces and flexible based on computational resources but does not guarantee the optimal configuration.
- Grid Search – Systematically evaluates all possible combinations from a predefined grid. It ensures the best combination within the grid but is computationally expensive for large search spaces. Cross-validation improves generalization.
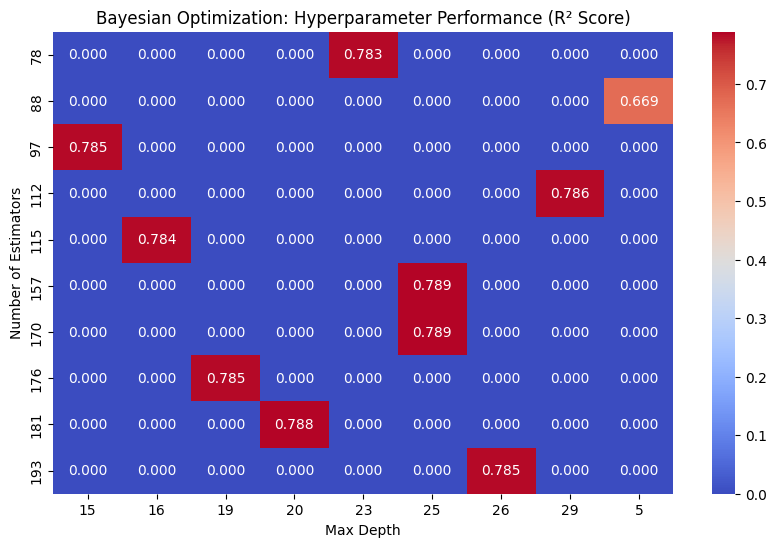
- Bayesian Optimization – Builds a probabilistic model using a Gaussian Process and acquisition function. It balances exploration and exploitation, requiring fewer evaluations, making it ideal for expensive model training.
In my Kaggle notebook, I explored hyperparameter tuning to optimize machine learning model performance. I implemented all 3 Optimizations.
Using Scikit-Learn, I applied Random Search to efficiently sample hyperparameter combinations, followed by Grid Search for exhaustive evaluation in smaller search spaces. Finally, I used Bayesian Optimization to iteratively refine hyperparameters by balancing exploration and exploitation.
I demonstrated how tuning improves accuracy and generalization. The results emphasizes the efficiency of Bayesian Optimization for complex models.
Task 6 : Image Classification using KMeans Clustering
K-Means is an unsupervised machine learning algorithm for clustering data into K groups. It is widely used in image segmentation, anomaly detection, and pattern recognition. K-Means minimizes the within-cluster sum of squares (WCSS). The Elbow Method helps determine the optimal K.
Steps in K-Means:
- Choose K – The number of clusters, selected using methods like the Elbow Method.
- Initialize Centroids – Randomly select K points or use K-Means++ for better accuracy.
- Assign Data Points – Assign each point to the nearest centroid using Euclidean distance.
- Update Centroids – Compute the mean of each cluster’s points to update centroids.
- Repeat Until Convergence – Stop when centroids stabilize or a max iteration limit is reached.
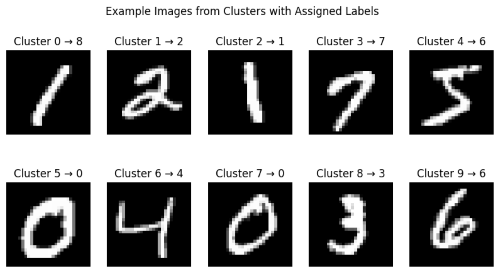
In my Kaggle notebook, I explored the MNIST dataset using K-Means clustering for image classification. The dataset consists of grayscale images of handwritten digits (0-9), each represented as a 28x28 pixel array. I preprocessed the data by flattening the images into 784-dimensional feature vectors and normalizing pixel values for better clustering.
Using K-Means, I grouped the images into 10 clusters, analyzing how well the algorithm categorized digits without labels. To evaluate clustering performance, I compared predicted clusters with actual labels.
Task 7: Anomaly Detection
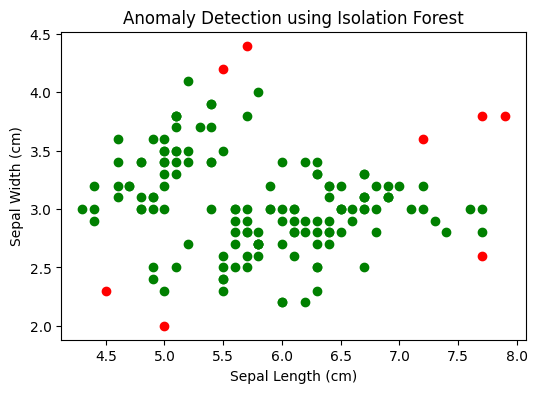
Anomaly detection identifies data points that significantly deviate from normal patterns. These anomalies indicates errors, fraud, unusual patterns, or rare events in a dataset.
Types of Anomalies
Point Anomalies → A single instance significantly deviates from the rest. Contextual Anomalies → A data point is abnormal in a specific context. Collective Anomalies → A group of data points shows an unusual pattern.
In my Kaggle notebook, I explored anomaly detection using unsupervised machine learning techniques. I applied algorithms like Isolation Forest and One-Class SVM to identify outliers in the dataset.
The data was preprocessed by handling missing values and normalizing features to improve model performance. I trained the models to distinguish normal patterns from anomalies and visualized the detected outliers for better interpretability.
The results highlighted Isolation Forest’s efficiency in handling high-dimensional data and One-Class SVM’s effectiveness in capturing complex anomalies.
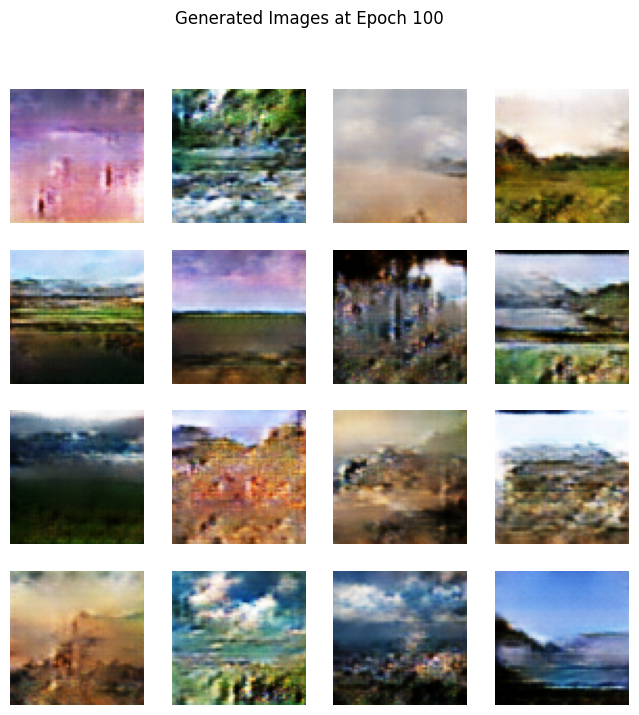
Task 8: Generative AI Task Using GAN
In my Kaggle notebook, I used a GAN to generate landscape images.To balance quality and performance, I used a lower resolution with progressive training. Techniques like mini-batch discrimination ,data augmentation and learning rate adjustments helped improve stability and training.The model couldn't generate the original resolution due to GPU limitations and memory constraints.
Gen AI
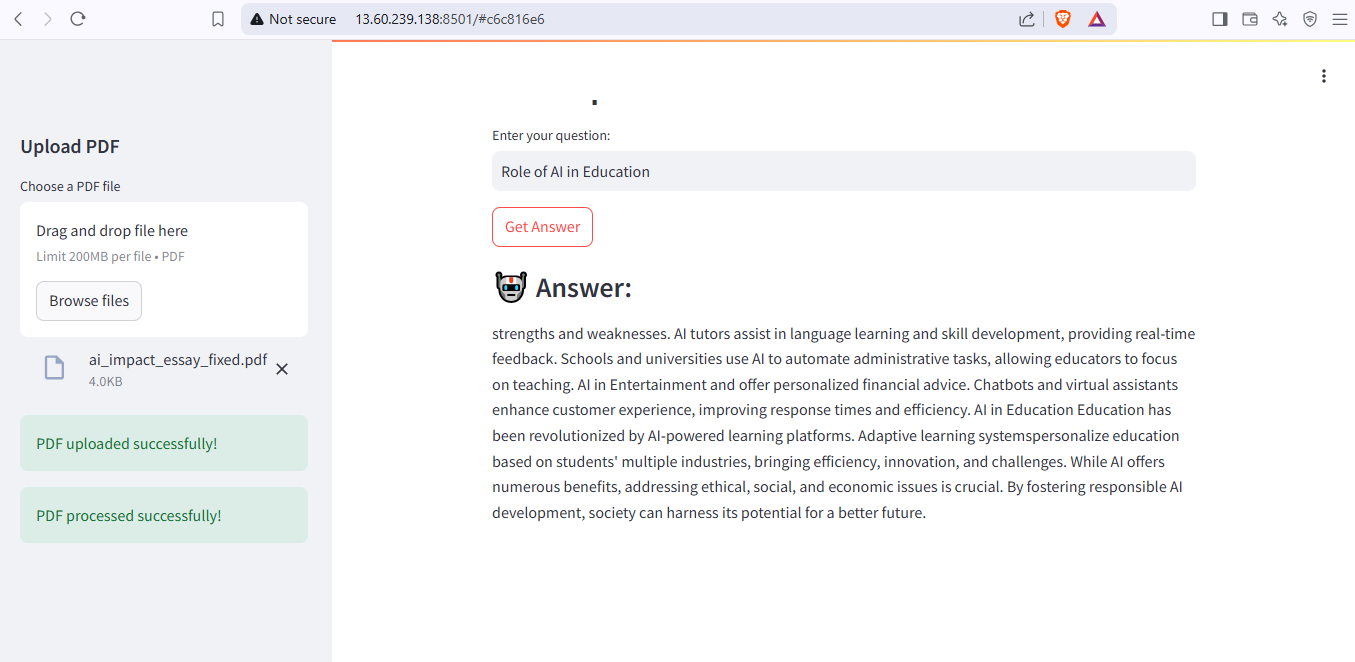
Task 9: PDF Query Using LangChain
I started by setting up the development environment, installing LangChain, ChromaDB, Streamlit, and Hugging Face embeddings within a Python virtual environment. Using PyPDF, I extracted text from the PDF and stored it in a .txt file. To process the text efficiently, I implemented RecursiveCharacterTextSplitter to divide it into manageable chunks. I then used Hugging Face embeddings for vector representation and stored them in ChromaDB. A retrieval system was developed to enable users to query specific sections of the document based on their input.
For deployment, I launched an EC2 t3.micro instance with Ubuntu on AWS and configured Python, a virtual environment, and necessary dependencies. The chatbot was deployed using FastAPI for the backend and Streamlit for the UI. I adjusted configurations to optimize query speed, and debugged errors related to API keys, model loading, and database persistence.
After ensuring the chatbot functioned correctly, I proceeded with shutting down AWS services. I terminated all running EC2 instances, and verified the billing dashboard for zero charges. Finally, I navigated to AWS account settings and confirmed termination.

Github
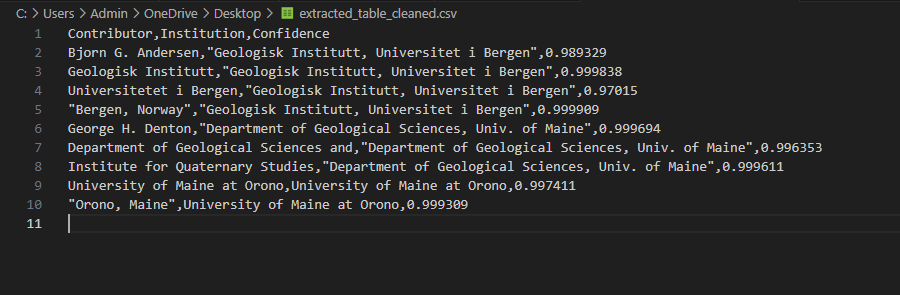
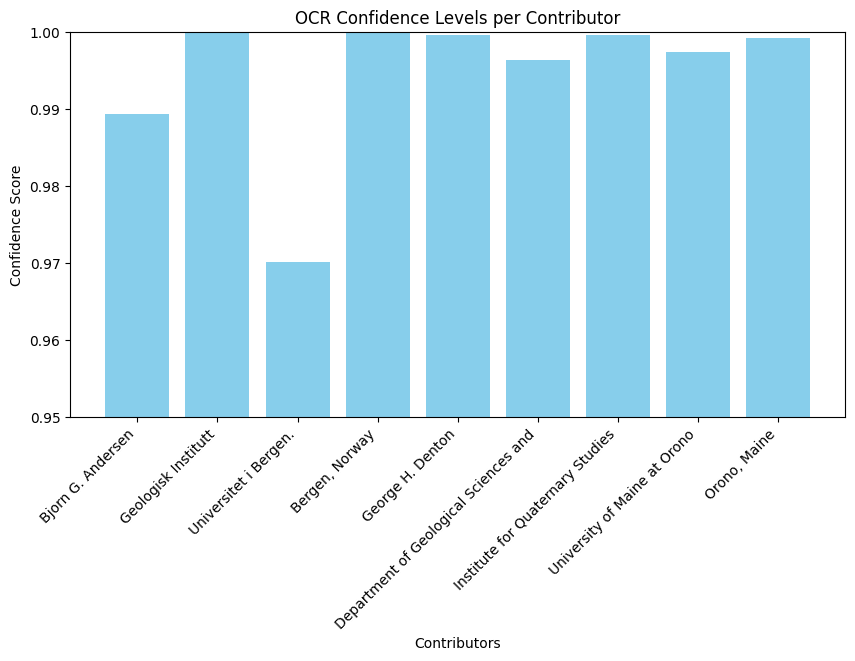
Task 10: Table Analysis Using PaddleOCR
I worked with images containing structured tabular data.The image lists contributors' names, affiliations, and present addresses from geological and quaternary studies institutes at various universities. I faced issues downloading PaddleOCR dependencies due to compatibility restrictions in the Kaggle environment. I resolved this by manually installing packages.
I fine-tuned PaddleOCR parameters, applied image preprocessing techniques like binarization and contour detection.
After debugging, the final pipeline successfully extracted structured tabular data, demonstrating PaddleOCR’s efficiency in document analysis.