Level 2
27 / 10 / 2024
Task 1 - Linear and Logistic Regression
Linear Regression
Linear regression is a supervised machine-learning algorithm that learns from the labelled datasets and maps the data points to the most optimized linear functions, which can be used for prediction on new datasets. First off we should know what supervised machine learning algorithms is. It is a type of machine learning where the algorithm learns from labelled data. Labeled data means the dataset whose respective target value(y) is already known.
The goal of the linear regression algorithm is to find the best Fit Line equation that can predict the values based on the independent variables.
In regression set of records are present with X and Y values and these values are used to learn a function so if you want to predict Y from an unknown X this learned function can be used. In regression we have to find the value of Y, So, a function is required that predicts continuous Y in the case of regression given X as independent features.
Later in task 5,I learned it from scratch.For a basic idea I predicted the price of perth houses based on multiple different variables using sci-kit’s linear_model.LinearRegression().

Here's the link for the kaggle notebook - Linear Regression
Logistic Regression
Logistic Regression is a statistical model commonly used for binary classification tasks, where the goal is to categorize data points into one of two classes. (e.g. predicting presence/absence of disease)
Key Concepts
1.Sigmoid Function:
Logistic regression uses the sigmoid (or logistic) function to map predictions to probabilities. The sigmoid function is defined as:
σ(z) = 1 / (1 + e^(-z))
where z = w * x + b.
2.Probability Output:
The output of the sigmoid function is a probability between 0 and 1. Logistic regression classifies based on a threshold (often 0.5):
- If ( P(y=1|x) > 0.5 ), the prediction is class 1.
- If ( P(y=1|x) <= 0.5 ), the prediction is class 0.
3.Cost Function:
Logistic regression uses the binary cross-entropy loss, which penalizes incorrect predictions. This cost function is minimized during training to improve model performance.
Cost = -(1/N) * Σ [yᵢ * log(h(xᵢ)) + (1 - yᵢ) * log(1 - h(xᵢ))]
where ( h(x_i) ) is the predicted probability for each example.
4.Training Process:
Gradient Descent is used to find optimal parameters ( w ) and ( b ) that minimize the cost function.The algorithm iteratively updates these parameters, improving model accuracy.
Later in task 5,I learned it from scratch.For a basic idea I trained a model to distinguish between different species of the Iris flower based on sepal length, sepal width, petal length, and petal width using sci-kit’s linear_model.LogisticRegression.
 Here's the link for the kaggle notebook - Logistic Regression
Task 2 - Matplotlib and Data Visualisation
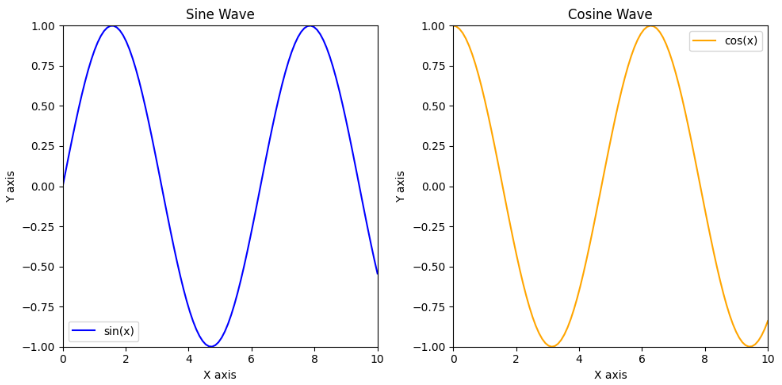
Matplotlib is a popular Python library used for data visualization. It provides tools to create a wide variety of static, animated, and interactive plots, ranging from simple line plots to complex multi-dimensional graphs.Data visualization is crucial for interpreting data trends, spotting anomalies, and conveying insights effectively.
Matplotlib allows detailed control over plot elements like colors, labels, styles, and grid layouts.It Works well with other Python libraries, such as Pandas for data manipulation and NumPy for numerical operations.It offers line plots, scatter plots, bar plots, histograms, box plots, pie charts, heatmaps, violin plots, area plots, 3D plots,multiple sub plots, stem plots, quiver plots, and step plots.
Matplotlib also has a user-friendly interface through Pyplot, which provides MATLAB-like commands that simplify plot creation, making it accessible even for beginners.
The task was to explore the various basic characteristics to plots with python libraries,make a multivariate distribution for the given dataset for a classification task and to understand an elementary idea of clustering.

Here's the link for the kaggle notebook-Matplotlib and Data Visualisation
Task 3 - Numpy
NumPy (Numerical Python) is a powerful Python library used for numerical and scientific computing. It provides support for large, multi-dimensional arrays and matrices, along with a wide range of mathematical functions like addition, subtraction, trigonometry, statistics, and linear algebra on these arrays.
The core feature of NumPy is its array object (ndarray), which allows for fast array operations and manipulation.It provides flexible methods for accessing and modifying subsets of arrays and facilitates operations on arrays of different shapes by expanding dimensions to match.It Works seamlessly with libraries like Pandas, Matplotlib, and SciPy.
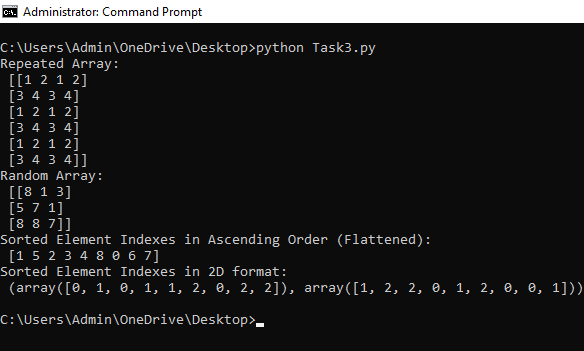
The task was to generate an array by repeating a small array across each dimension and to generate an array with element indexes such that the array elements appear in ascending order.

Here's the link for the code-Numpy
Task 4 - Metrics and Performance Evaluation
In both regression and classification, metrics are used to evaluate the model's performance by assessing how well the predicted values align with the actual data.
Regression Metrics
The metrics focus on assessing the accuracy of the predictions relative to the actual values.

Here's the code implementing the Regression metrics-Regression metrics
Classification Metrics
The metrics evaluate the model’s ability to classify correctly.
 Here's the link implementing the Classification metrics-Classification Metrics
Task 5 - Linear and Logistic Regression - Coding the model from SCRATCH
Linear Regression from scratch -
Building linear regression from scratch involves using the least squares method to minimize the error between predictions and actual values, calculating optimal weights through gradient descent -
Logistic regression from scratch -
For logistic regression, you apply the sigmoid function to model probabilities and optimize using binary cross-entropy loss, also typically with gradient descent - Logistic regression
Task 6 - KNN
K-Nearest Neighbors (KNN) is a intuitive algorithm used for classification and regression tasks in machine learning. It operates based on the principle of proximity, making decisions based on the 'K' closest data points in the feature space.
KNN is an instance-based learning algorithm, meaning it doesn’t explicitly learn a model from the training data. Instead, it memorizes the training dataset and makes predictions based on the instances in that dataset.
KNN relies on a distance metric to determine how close two points are. Common distance metrics are:Euclidean Distance: Measures the straight-line distance between two points in Euclidean space.Manhattan Distance: Measures the distance between two points in a grid-based path.Minkowski Distance: Generalization of Euclidean and Manhattan distances.
The parameter 'K' represents the number of nearest neighbors to consider when making a prediction.A smaller K can be sensitive to noise in the data, while a larger K may smooth out class boundaries.Choosing the right K is crucial; cross-validation is often used to find the optimal value.
 Here's the code-KNN
Task 7:Neural Networks
Neural networks are computational models inspired by the human brain, designed to recognize patterns and solve complex problems. They consist of interconnected layers of nodes, known as neurons, which process data and learn from it.
Large language models (LLMs) are advanced artificial intelligence systems designed to understand and generate human language. They are trained on vast datasets, allowing them to predict text, answer questions, and engage in conversations. LLMs leverage deep learning techniques, particularly neural networks, to process and generate natural language effectively.
The task was to write a blog about your understanding of Neural Networks and types like CNN, ANN, etc and to learn about Large Language Models at a basic level and make a blog post explaining how you would build GPT-4.
Task 8 - Mathematics behind machine learning
Curve fitting
 In Desmos, curve fitting involves finding a mathematical model that best matches a set of data points by minimizing the error between the model and the points. To start, input your data in a table. Then, select a function type (e.g., linear, polynomial, exponential) that you believe fits the data. Enter the model equation in Desmos using a tilde (~) instead of an equal sign (=) to initiate regression. Desmos calculates optimal parameter values for the model, showing the resulting curve on the graph. This curve-fitting process is useful for understanding trends and making predictions based on data.
Fourier Transform
 The Fourier Transform is a mathematical technique that transforms a time-domain signal into its frequency-domain components. It decomposes a complex signal into a sum of simple sine and cosine waves, each with specific frequencies, amplitudes, and phases. By revealing which frequencies are present and their intensities, the Fourier Transform helps identify patterns and behaviors in data that are not visible in the time domain. The result is a spectrum that shows how much of each frequency exists in the original signal.
Task 9 - Data Visualization for Exploratory Data Analysis
Plotly is an interactive graphing library for creating data visualizations in Python, R, and JavaScript. Known for its flexibility, Plotly supports a wide variety of chart types, including line, bar, scatter, heatmaps, 3D plots, and more. Plotly’s straightforward syntax allows users to easily modify visuals with custom colors, labels, and tooltips, enhancing data exploration and presentation. It’s widely used in data science and analytics for its integration with libraries like Pandas, making data visualization both powerful and accessible.
 Plotly
Task 10-An introduction to Decision Trees
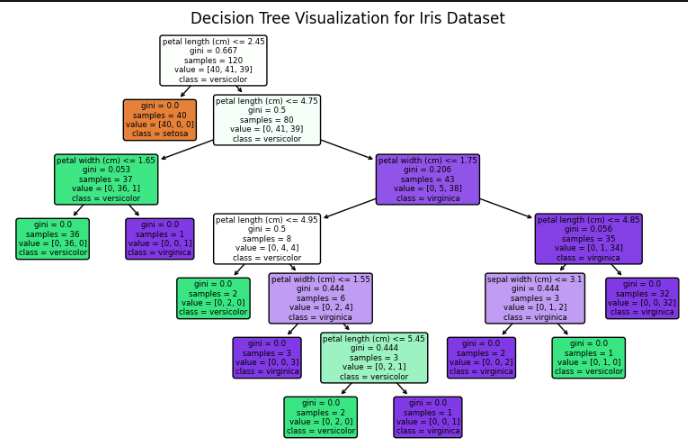
Decision trees is used for both classification and regression tasks. They structure decisions in a tree-like model, where each internal node represents a decision based on a feature, each branch represents an outcome of that decision, and each leaf node represents a final prediction. The model splits data into subsets based on the most informative features, optimizing for criteria like information gain (for classification) or variance reduction (for regression). Decision trees are intuitive, easy to interpret, and handle both numerical and categorical data well. However, they can be prone to overfitting, especially with deep trees.
 Decision Tree
Task 11 - Support Vector machines
SVM works by finding a hyperplane (or boundary) that best separates data points from different classes. This hyperplane is chosen to maximize the margin—the distance between the nearest data points of each class, known as support vectors, and the boundary. By maximizing this margin, SVM aims to improve model generalization to new data. It can work well with both linear and non-linear data by using kernel functions, which transform data into higher dimensions for better separability.
The task was to use the concept of Support Vector Machines to detect the possibility of breast cancer.
 SVM
SVM

