Marvel level 2 report
4 / 6 / 2025
Task 1 - Linear and Logistic Regression - HelloWorld for AIML
Linear Regression:
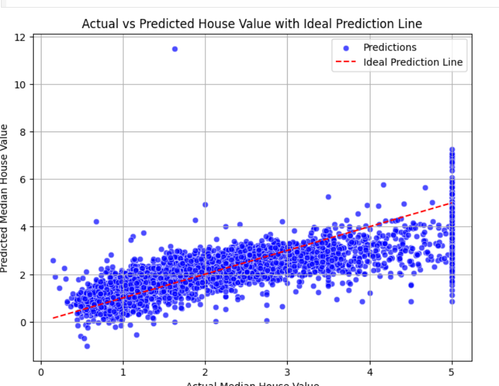
Linear regression analysis is used to predict the value of a variable based on the value of another variable. I used the "California housing dataset" for this model . The goal is to find the best-fitting line through the data points that minimizes the difference (errors) between the predicted and actual values of the dependent variable. Here is the github link: https://github.com/ShashankMk031/Marvel_2_1_LinearRegression
Logistic regression:
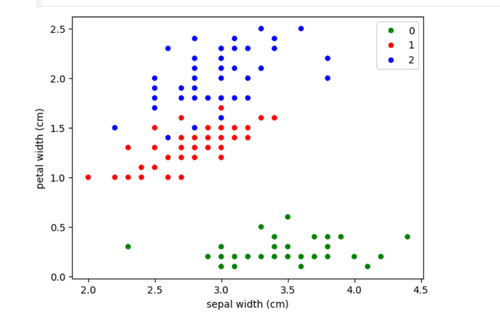
Logistic regression estimates the probability of an event occuring. It provides a binary output (1 or 0, true or false, success or failure) based on one or more independent variables. The dataset used is the "iris dataset" that has 2 categories . Here is the github link : https://github.com/ShashankMk031/Marvel_2_1_logistic-regression
Task 2 - Matplotlib and Data Visualization:
Data Visualization is the process the data for a model is represented in graphs like ( histogram , scatter plot etc) to understand the data visually. For this task I've used the Absentism at work dataset , and plotted the data . Here is the github link : https://github.com/ShashankMk031/Marvel_2_2_Matplotlib-and-Data-Visualization
Here are some samples:
Histogram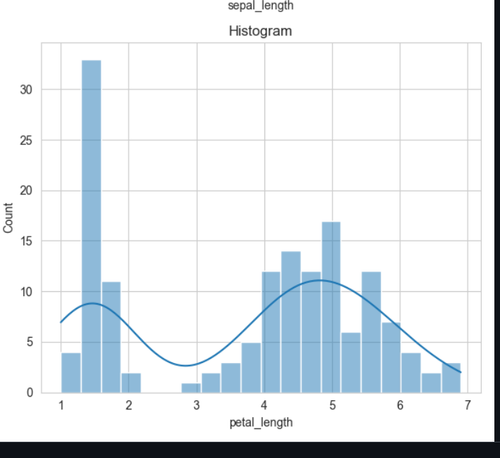
Bar Plot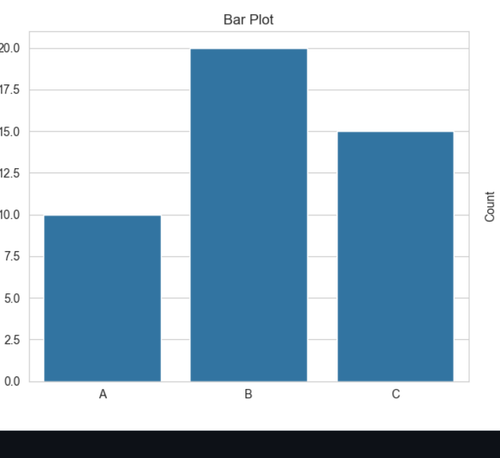 3D plot
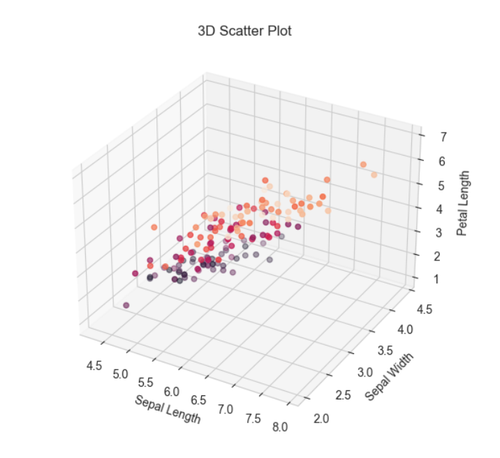
Violin plot 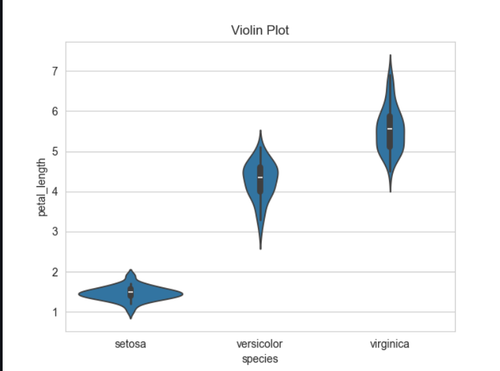
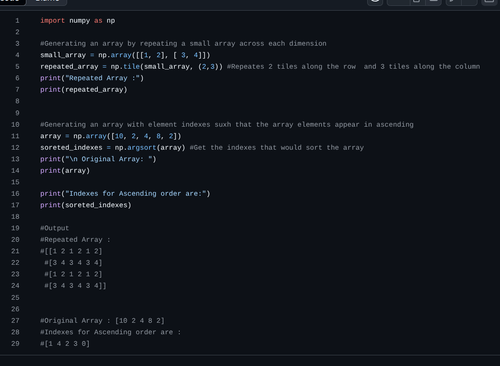
Task 3 - Numpy:
Numpy is a Python library used for numerical computing. It provides support for arrays, matrices, and various mathematical functions to operate on these data structures efficiently.Here is the github : https://github.com/ShashankMk031/Marvel_2_3_Numpy
Task 4 - Metrics and Performance Evaluation:
Metrics and performance evaluation are essential for assessing the accuracy and effectiveness of machine learning models. Here is the github link that has a report on the evaluation of Regression and Classification metrics. https://github.com/ShashankMk031/Marvel_2_4_Metrics-and-Performance-evaluation
Task 5 - Linear and Logistic Regression - Coding the model from SCRATCH:
Linear regression :
Linear regression is a fundamental statistical method used to model the relationship between a dependent variable (target) and one or more independent variables (features).aims at finding the best fit straight line that passes through the given data. This straight line provides the relationship between the independent variables and dependent variables.Simple linear regression can be written as " y = wx + b".
where w is the weights and
b is the bias.
Logistic regression:
models the probability that a given input belongs to a particular category. It's commonly used for binary classification problems, where the output variable has two possible outcomes, i.e, 0 or 1. It works on sigmoid curve and the equation is 1 / ( 1 + e^y(x))
where y(x) is the linear regression equation.
Here is the github link: https://github.com/ShashankMk031/Marvel_2_5
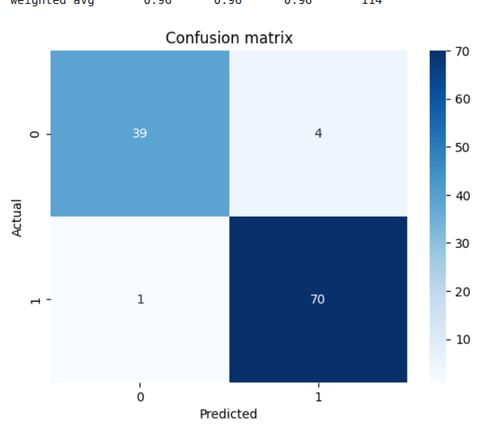
Task 6 - K- Nearest Neighbor Algorithm:
In this task I implemented KNN algorithm on "load_breast_cancer" dataset from sklearn.datasets. It is a simple yet powerful supervised learning technique , it works by identifying the ‘k’ nearest data points to a new input and classifying it based on majority voting. It’s a lazy learning algorithm, meaning it doesn’t require model training and makes predictions directly using the training data. Link for code: https://github.com/ShashankMk031/Marvel_2_6
![Task6]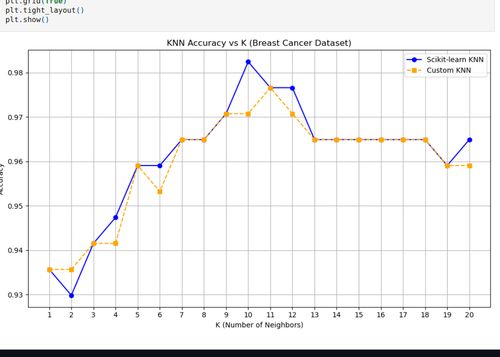
Task 7: An elementary step towards understanding Neural Networks:
Neural networks are computational systems inspired by the structure and functioning of the human brain. They are the fundamental component of many Machine learning models. ANNs and CNNs come under the types of neural networks.Blog link : https://github.com/ShashankMk031/Marvel_2_7/blob/main/Neural_nets.md
Large-scale language models (LLMs), like GPT and BERT makes computers understand and generate human language. Using transformer architectures, which process entire sentences at once, LLMs can grasp the context of words more effectively than previous models like RNNs. Trained on massive text datasets through unsupervised learning, these models learn to predict words and understand language structure. Here is a blog on how to train a gpt model : https://github.com/ShashankMk031/Marvel_2_7/blob/main/gpt4_building.md
Task 9: Data Visualization for Exploratory Data Analysis:
Plotly is a dynamic tool, much better than others like matplotlib and seaborn for data visualization. Here is a scatter, line, histogram and a box plot on the classic Iris dataset and a 3D plot on "iris dataset" from sklearn.dataset. Github link: https://github.com/ShashankMk031/Marvel_2_9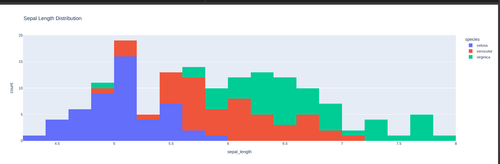
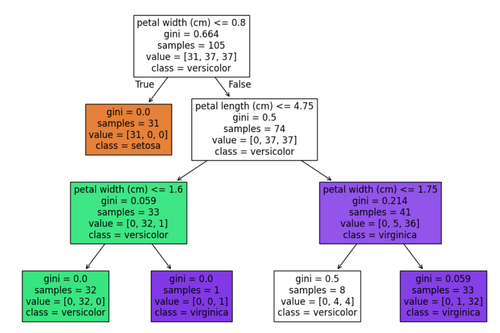
Task 10: An introduction to Decision Trees:
A Decision Tree is a popular, supervised machine learning algorithm used for both classification and regression tasks. It works by breaking down a dataset into smaller subsets based on feature values, creating a tree-like model of decisions and their possible consequences. It has some metrics for impurity calculations, like gini impurity, entropy etc. THe github link for decision tree: https://github.com/ShashankMk031/Marvel_2_10
Task 11: SVM:
SVM-Support Vector Machine is a simplest and the elegant way used for classifications. They make classifications by drawing hyper-planes, between the data to classify them into different groups(Categories). Though they are simplest , they are sensitive to outliers, and sometimes may give the wrong predictions due to outliers. Therefore, we have to process our data before giving it to the SVM. Code for SVM : https://github.com/ShashankMk031/Marvel_2_11
Here is the confusion matrix of breast cancer prediction for better understanding.