AIML LEVEL 1 REPORT
2 / 6 / 2025
Task-1 : Linear and Logistic Regression - HelloWorld for AIML
My first introduction to AIML was through boston housing pricing which not only help me predict the outcome but also introduced me to the concept of linear and logistic regression alongside multiple usage of python library like sklearn It taught me linear regression ( to predict a continuous value based on input features ) And logistic regression ( to classify and observation in two or more categories and the format of 0 and 1) I followed the YouTube material provided in Marvel source
https://github.com/Avantikalal5805/Aimltask-1/tree/main
Task 2: Numpy
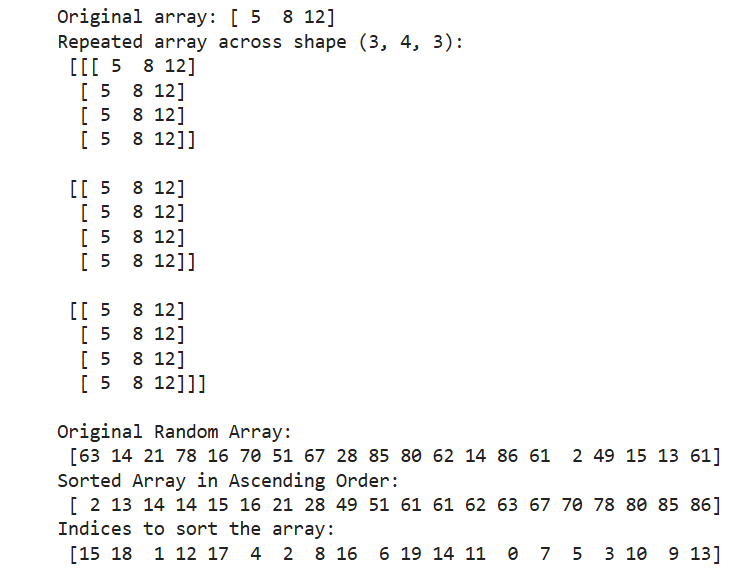
I began learning NumPy, a key library in data science and machine learning. I explored array creation, reshaping, and repetition with the np.tile() method. I also generated arrays using np.arrange(), sorted random values, and retrieved sorted indices. To reinforce my understanding, I documented essential methods and syntax in a Jupyter Notebook .
https://github.com/Avantikalal5805/numpy/blob/main/Numpy.ipynb
Task 3 : K- Nearest Neighbor Algorithm
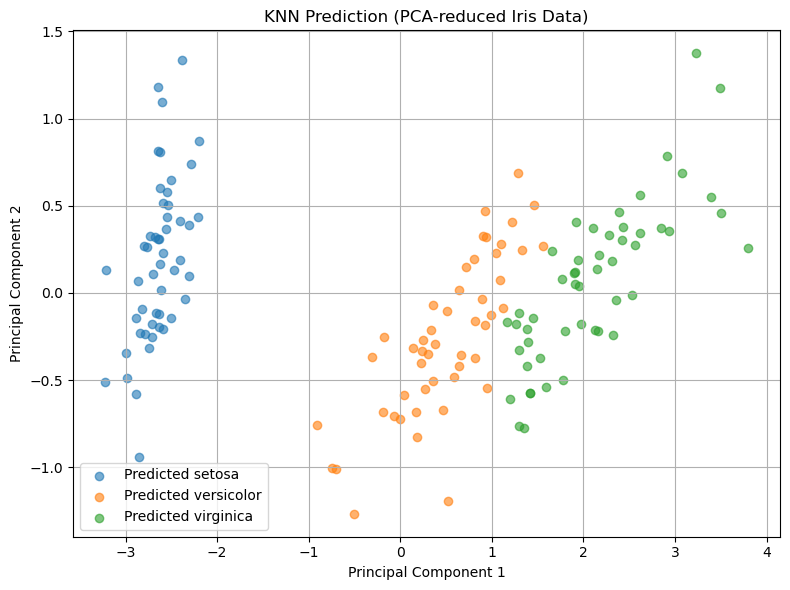
I learnt about the K-Nearest Neighbor algorithm, a straightforward yet effective supervised learning method. KNN classifies a new data point by identifying its ‘k’ closest neighbors and assigning the most common class among them. Since it's a lazy learner, it doesn’t involve a lot of training and instead makes predictions directly from the training dataset. Using scikit-learn’s KNeighborsClassifier, I applied KNN to datasets like Iris, Wine, and Breast Cancer, experimenting with various values of ‘k’ and distance metrics to observe their impact on model performance. I also realized the critical role of feature scaling, as KNN heavily relies on distance calculations. Enhancing my understanding, I implemented KNN from scratch in Python. This hands-on approach helped me understand how distances are computed, neighbors are selected, and predictions are made. When I compared the custom implementation to the scikit-learn version, I noticed similar results, though the library version was more efficient. Overall, this exercise gave me a strong understanding of how KNN works.
https://github.com/Avantikalal5805/knn/blob/main/knn.py
Task-4: An elementary step towards understanding Neural Networks
I was intrigued by the idea of remodeling the ChatGpt model and also learn about Neutral Network and its components , I explored different types like ANN and CNN through hands-on coding I looked into how transformers, self-attention, and token embeddings drive language comprehension. By breaking it down step by step, I connected neural networks to the workings of large models like GPT. Here’s what I learned.I investigated the role of transformers, self-attention, and token embeddings in enhancing language comprehension. While intricate, analyzing it gradually allowed me to link neural networks to the functioning of large models such as GPT. Here are my insights. https://hub.uvcemarvel.in/article/a18e419c-3f3a-4b88-8ed8-2202062a0c5e https://hub.uvcemarvel.in/article/b29e45a8-3a59-4095-b5f8-3904f3a89288
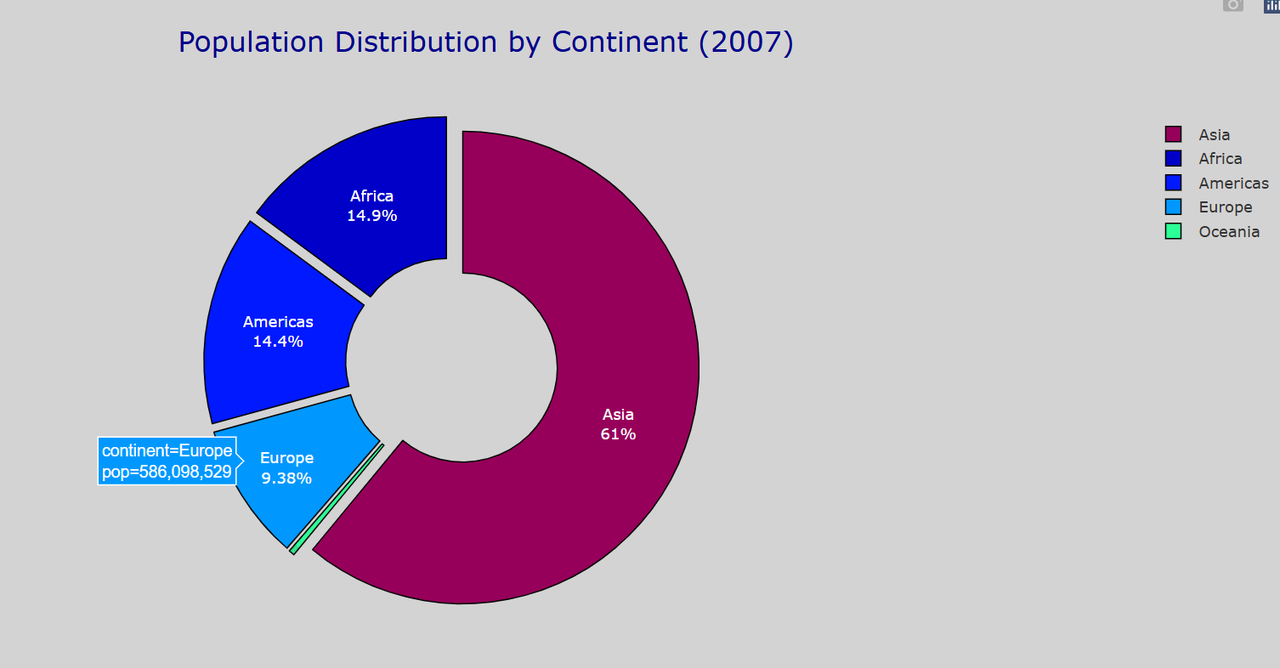
Task-5: Data Visualization for Exploratory Data Analysis
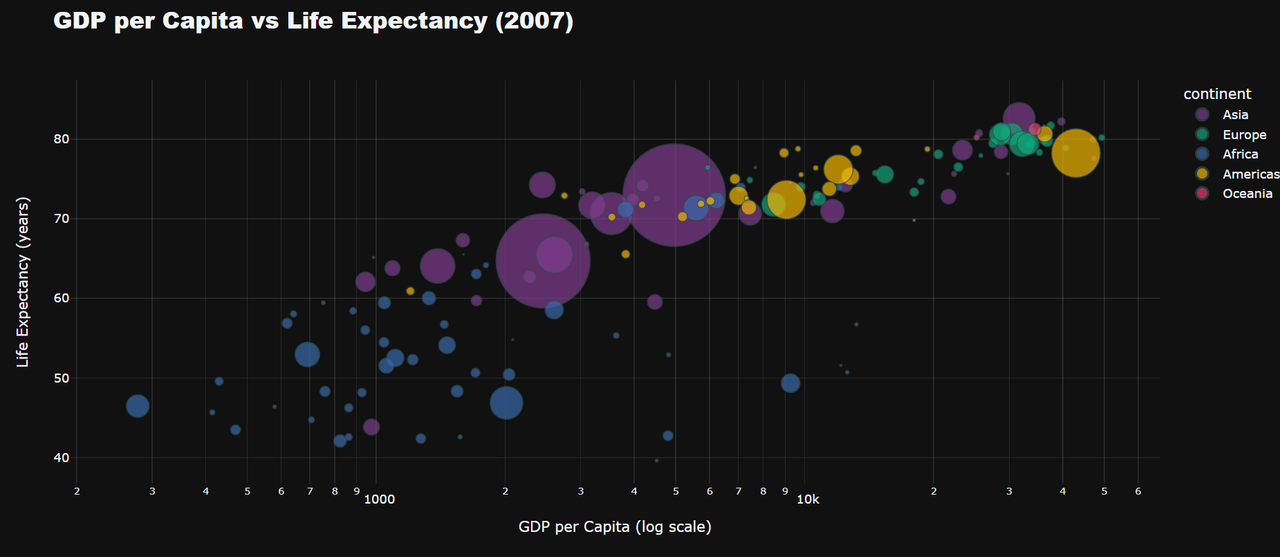
Plotpy is one of the most powerful python library and I explored its application and how easy it was to create dynamic, web-based plots with minimal code . I used my reference of the life expectance and GDP relation and with this python library I could create the visuals to represent the data. Plotly stands out from static tools like Matplotlib by allowing real-time interaction and exploration
 https://github.com/Avantikalal5805/datavisual/blob/main/TASK%205.ipynb
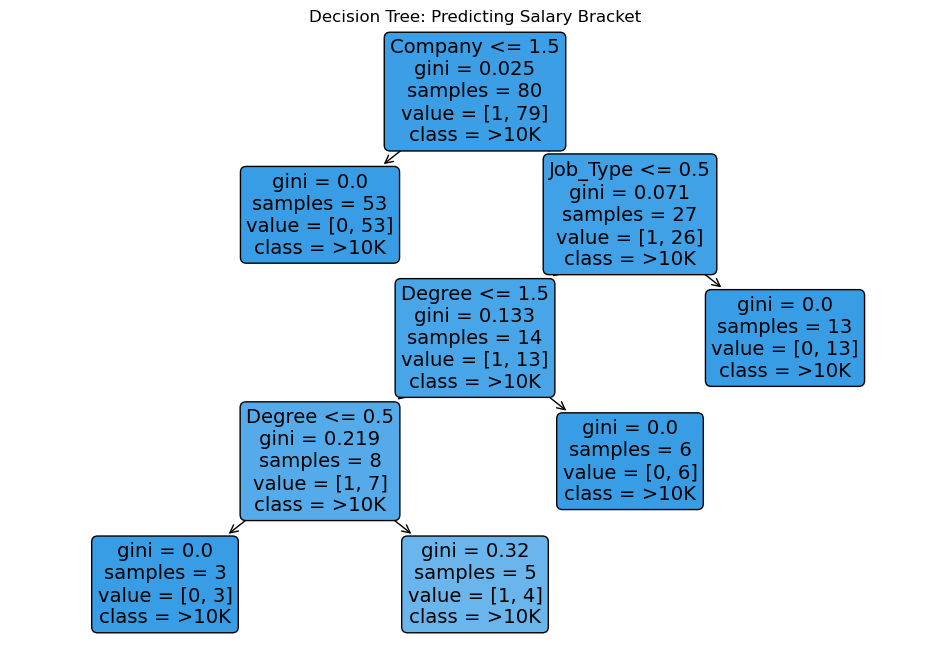
Task-6: An introduction to Decision Trees
Decision tree is a combination of both regression and classification method and this usually has a conditional approach of a yes or a no to a problem and thus makes a flowchart of decision that way .
In this task , I focussed on a companies employee and their salaries and based upon that there were conditions on salaries
https://github.com/Avantikalal5805/decisiontree/blob/main/Task%206.ipynb
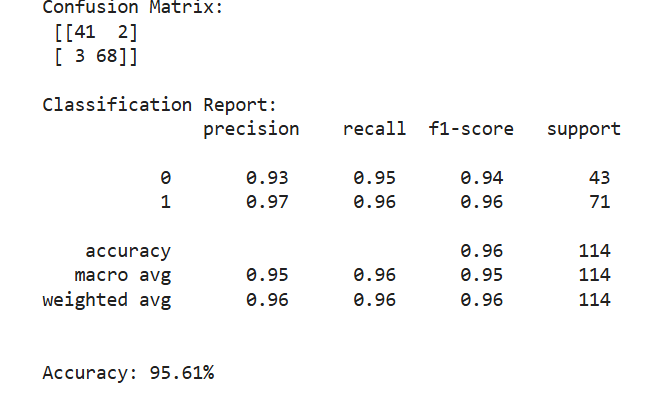
Task-7 : Support vector machines
SVM is widely used for regression and classification task . It uses hyperplane ( use to act as a margin between two data boundries and acts as a decision boundary .Using SVM on the Breast Cancer dataset provided me with hands-on experience in developing models that assist in medical diagnosis. This exercise helped me understand the essential concepts like margin maximization, the application of kernel tricks for handling non-linear data, and the significance of regularization in managing model complexity.
https://github.com/Avantikalal5805/svm/blob/main/Task%2011.ipynb