
COURSEWORK
Dhruv's AI-ML-001 course work. Lv 2
| Dhruv | AUTHOR | ACTIVE |
LEVEL 1 final report
1 / 4 / 2024
Task 1:
Learned Basics of ML
- Learned how to use Pandas and make dataframes.
- Implemented the most basic and commonly used algorithm, linear regression.
Later in task 5, coded it from scratch, learned the general idea, and obtained some results using it. This task was like the stepping stone into the machine learning world!
This is the super basic Kaggle file of the code:
Task 2:
Plots and Data Visualization
This task was amazing and taught me the different ways to visualize the data we have and how it can be used. I made my own first data set also in this task, which helped me realize how to upload in Kaggle.
Understood the various uses of these different types of plots.
These plots included simple 2D line graphs to contour plots. This also served as a solid base for later tasks that needed these basic plots at regular times.
Task 3:
Numpy
One cannot stress the importance of numpy later on. It's so helpful and versatile, from making arrays and summing and using exponent all of the important mathematics used this. This task taught us how to use numpy and the arrange functions.
import numpy as np
a=np.arange(18)
print(a)
b=a.reshape(3,2,3)
print(b)
Output:
[ 0 1 2 3 4 5 6 7 8 9 10 11 12 13 14 15 16 17]
[[[ 0 1 2]
[ 3 4 5]]
[[ 6 7 8]
[ 9 10 11]]
[[12 13 14]
[15 16 17]]]
Task 4:
Metrics!!
There are two types of metrics:
- Regression: Used when we are predicting some value and can use the difference of error (The Error is numeric).
- Classification: Used to measure things like how the model is doing for false negative or wrong classification.
This is for Regression Metrics:
Here I used the California houses to predict the houses and then calculated how the model does based on the different types of Regression Metrics:
- Mean Absolute Error (MAE)
- Mean Squared Error (MSE)
- Root Mean Squared Error (RMSE)
- R² (R-Squared)
This is for classification Metrics:
Here I used a model that had already cleaned and done everything, I just used the different techniques to find the Metrics. This part of the task taught the different times when we might need to adjust our model.
Let's say there is a person who goes for cancer screening, we would rather give him a false positive saying he has cancer than a false negative. That ways we need to see what kind of model is better for which application.
Area Under the Curve and ROC (This curve plots two parameters: True Positive Rate, False Positive Rate)
Task 5:
Linear Regression from Scratch
This task taught me to imagine data as vectors and how to multiply the vectors, using transpose and taking partial differentials.
This task took a long time but made my foundation on concepts that I knew much stronger. I can confidently make a better model now for sure, but this model is what took me days. Also learned how to call elements in the Pandas using iloc[].
Cost Function:
In task 4, we learned about MSE. Here we used it as the cost function to correct our model using gradient descent to fix the parameters.
Gradient Descent:
Understood and used gradient descent for the first time. The most useful algorithm to minimize the cost function. Learned basic terms like the learning rate and importance of optimizing learning rate and the iterations of the model.
Task 5 (part2):
Logistic Regression from Scratch
This task took the longest time, I had to do literal notebook maths to understand the sigmoid function. The differential equation is down below. Understood the equation and the curve and why we are doing each and every step!
Brief Summary how logistic regression work:
- The function only gives 0 and 1 based on some threshold value after which it's a 0 or 1.
- To get a function like this, we use the sigmoid function.
- Now that we got how to get output values using the inputs of parameters, we need a cost function.
- We use the likelihood of parameters to get the cost, as per the curve in the file, one can see we trying to get the best parameter for our algorithm.
- Learned about gradient ascent and how to get that. Set a threshold value too.
- Didn't really optimize the algorithm to the best learning rate due to time constraints and random data.
The differential of the cost function with respect to the parameters:

Task 6:
KNN from Scratch
The lazy algorithm
KNN is used when we are trying to classify an item into different groups using distances. The distance can be using different techniques like the normal Euclidean distance or Manhattan (just subtracting and taking the absolute value).
Depending on the K value passed and input for which we calculating we show the nearest neighbors using which we can somewhat predict which group it might belong to.
Task 7:
GPT and Transformers
This was a very interesting research-related task. I read and went to a workshop on this to understand what really does happen behind the screens and how the transformer works. I have uploaded the article on the MARVEL website too! I attended a workshop in IIIT Bangalore by ACS and Azure.

Hope this read helps!
This is an interactive read on CNN, I have shown how the inputs are taken and filters are used which are normally hidden inside.
This is one of the three videos, showing edge filtering basics.
Task 8:
Curve fitting:
Watched the reference material and understood how to plot graphs for the data. Made 2 sets of data using which I tried implementing a classification and linear regression by controlling the y=mx+c. The line was moved so that we made a boundary line for differentiating the 2 data sets. For linear regression changed the values of m and b till the line was as near to the points thus reducing the MSE or the cost function!
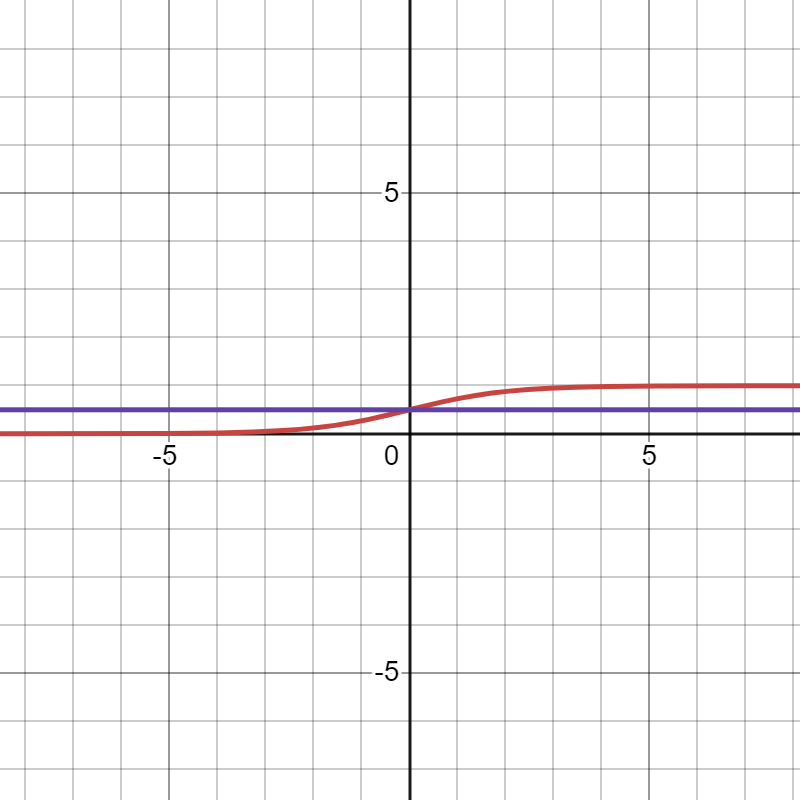
Sigmoid:
Used for logistic Regression using a threshold, I have put the purple as threshold of 0.5. Based on the data, this can be edited! Gives values between 0 and 1.
Linear:
This is the simple y=mx+c line, this line is what is used for our linear regression except there are more parameters. I did linear regression for two sets of data. We alter the c value which is the y-intercept and the slope that is m.
.png?raw=true)
Boundary Line:
I added 2 sets of data to Desmos and then plotted a boundary line which divides the 2 data sets like a decision tree kind of!
.png?raw=true)
Fourier Transforms
Watched the amazing video by 3blue1brown. Understood how vectors can be represented by Euler's number and how the Fourier transformation can be used to find the individual components of many waves.
Understood how the Fourier series is the sum/integration as we keep adding different sine waves to get any function. This is useful in many applications and was shown how it can be used as multiple vectors to draw.
Based on the video coded the below page and found Fourier transformation of a sine wave!
Task 9:
Plotly
This was a wonderful library adding so much more vibrancy and better ways to visualize the data. I learned how to plot basic graphs like line, scatter and distribution, and bar graphs. These are the most basic graphs and understood how to use Plotly as a way to make data frame which makes it easier to work with. They use ingenious ways like color to show variance and differences. Then they also use the size of the scatter plot to show another parameter.
The hover function helps when doing tasks like KNN and we want to cross-check for a specific data. I did go through the advanced features like adding sliders and animations too.
Plotly is a really dynamic and nice library.
This is the MRI Scan using Plotly, Plotly is a really strong tool!
Task 10:
Introduction to Decision Trees
Type of supervised learning algorithm that can classify and solve regression tasks. It uses conditional statements as a hierarchy (root to branches to leaf). The order of statements is based on some criteria like Gini (formula in the Kaggle file) or cross entropy. We use this to get the roots and segregate the data to make it easy to predict using that.
We use cross-validation to evaluate the model's performance more reliably. This helps us by avoiding overfitting to a fixed validation set and making it better use of the entire training set. Sometimes, the data can be less on 1 side of the branch thus not letting the model be 100% accurate that is why we can vary the conditions of leaf and branches and the conditional statements itself, for the best accuracy for the model!
Task 11:
Case study of application:
Due to the case study being real-life and sensitive I cannot explain it in detail but here goes:
As told real-life applications of machine learning aren't just that simple, luckily, an uncle I know has some experience so I will be writing about his experience as a case study!
Getting data:
The data usually stored in most of India is still not digitalized. He worked on a project to make an ML model to get the data; he had to digitalize the data and use queries and collect all of it in a warehouse/lake.
This process is the core of any type of AI or ML as the quality of data determines good results. We call this kind of data as preprocessed data.

Now making sense of data:
The data has to undergo cleaning; this can mean seeing how many values we got of some parameters, if we get less values and mostly NULL then we will drop that data or we make sense of the less data if it's useful or not.
We understand the data and make relationships and plot the data to get a better visualization and see if it's useful for the output we want.
After this, we get the parameters needed.
Selecting a Model:
Based on the output we need we select the model, in this case, they used K-Mean clustering the data was of a financial institution. Few of the parameters were:
Transaction history, customer relationship with other loans, gender, flagging customers geographic and seasonal patterns.
Now working the model:
After running the model, we get the clusters; these are the different people we get. Now using the model we save the clusters profile for analysis.
Train KMN model:
We train the model with more feedback data we would get back from the feedback. The model generates new output which are new products the financial institution can sell more products. This is called cross-sell.
Branch:
When an existing customer walks in the branch using the data and model can tell the products the we can sell to him/her based on the model. The branch provides the feedback to the model and thus making it more accurate! This creates a feedback loop.

Summary:
Why we use K-Means here?
Offer personalized products, Segment different customers, Promote different products, Purchase pattern of customers, Customer demographics, Using customer recommendations based on branch feedback.
I hope this case study helped in seeing how real-life actually has so much more than machine learning! Also getting the data and maintaining clients needs very good communication skills!