
COURSEWORK
Apeksha's AI-ML-001 course work. Lv 1
| Apeksha Naik | AUTHOR | ACTIVE |
LEVEL 0 AIML DOMAIN COURSEWORK
15 / 3 / 2026
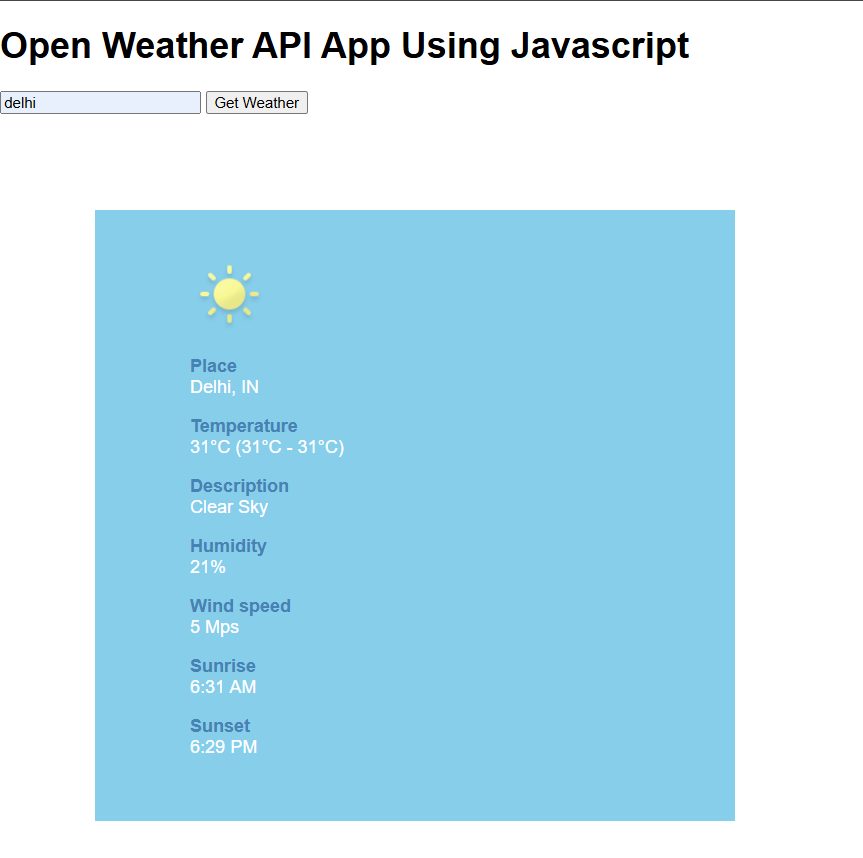
TASK 2 : API
APIs, or Application Programming Interfaces, are the invisible backbone of modern software development. They enable applications and systems to communicate and share data efficiently. Developed a weather api that gives information about the temperature of cities. Used HTML, Javascript and CSS.
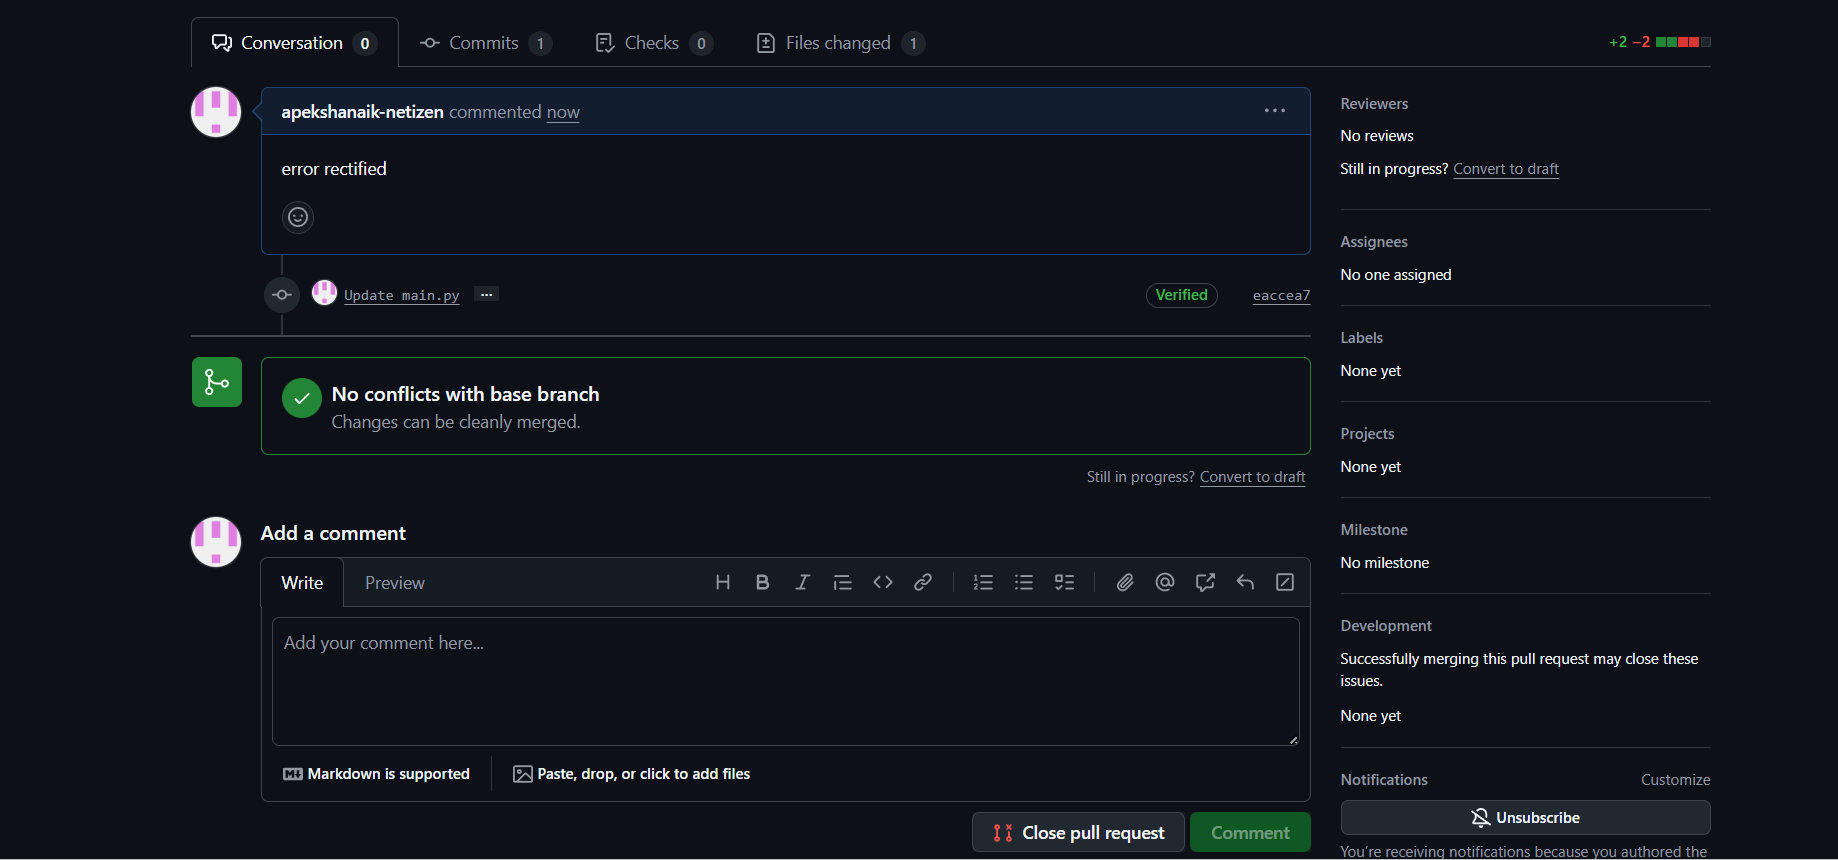
TASK 3 : Working with GitHub
I understood how to create a new branch, make changes to the code, and commit those changes using Git commands. Forked the repository, made the necessary changes to the code and proposed a pull request.
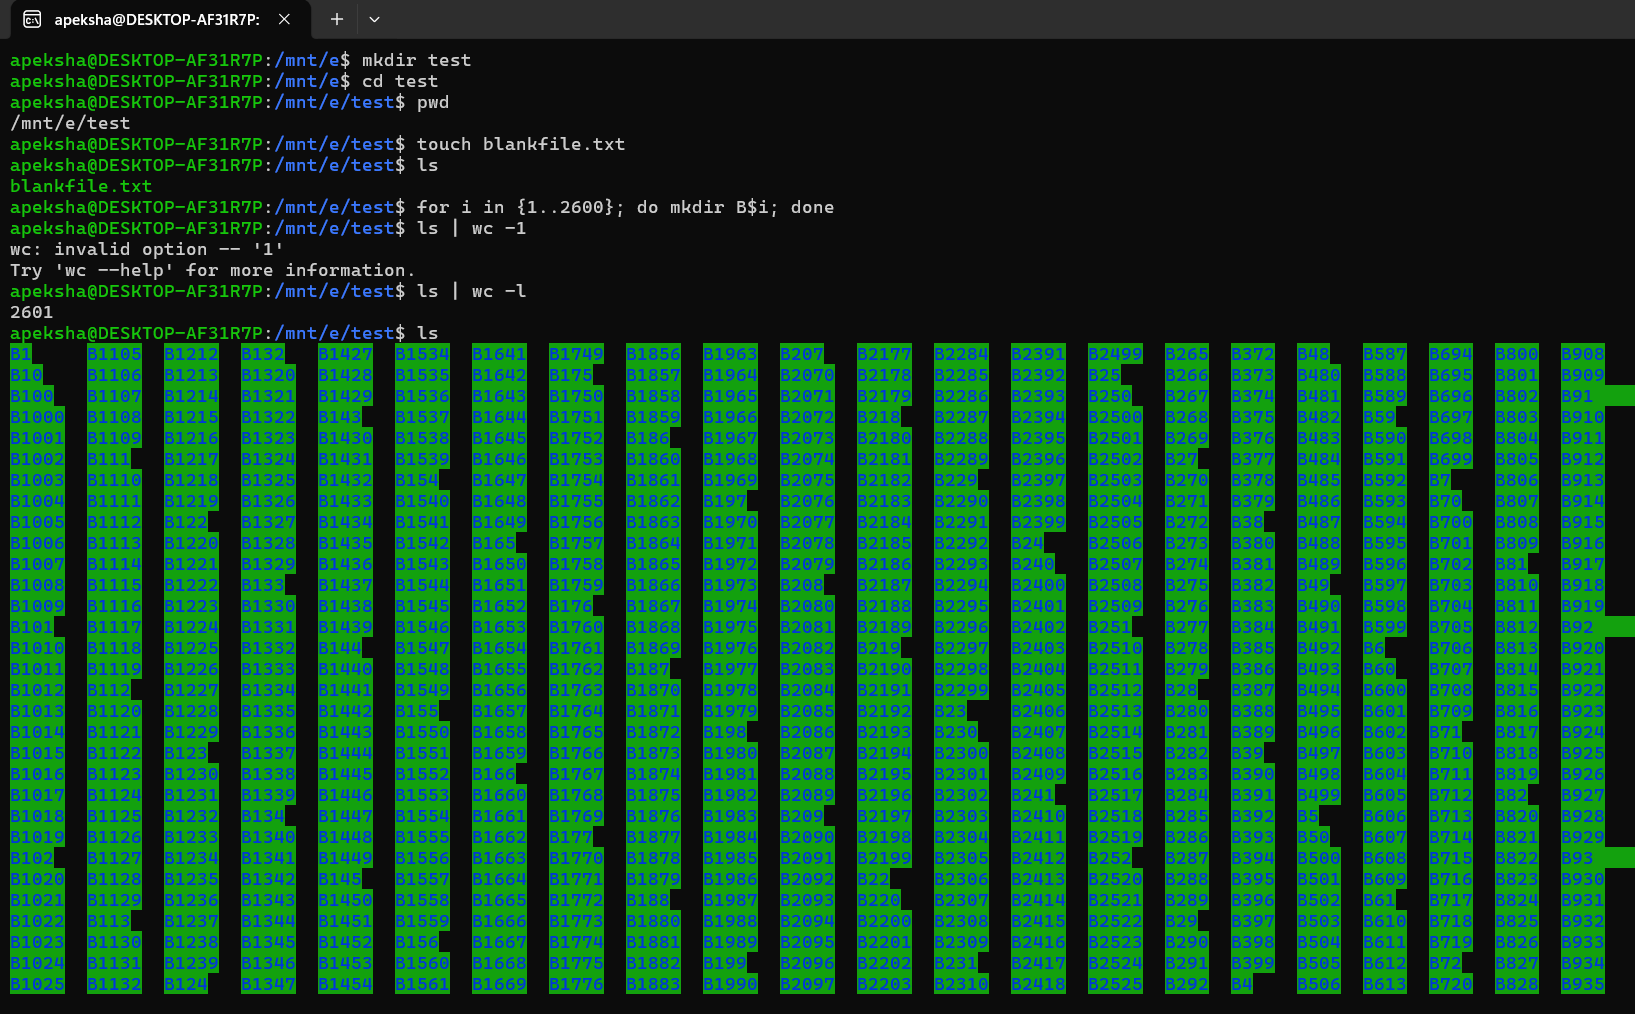
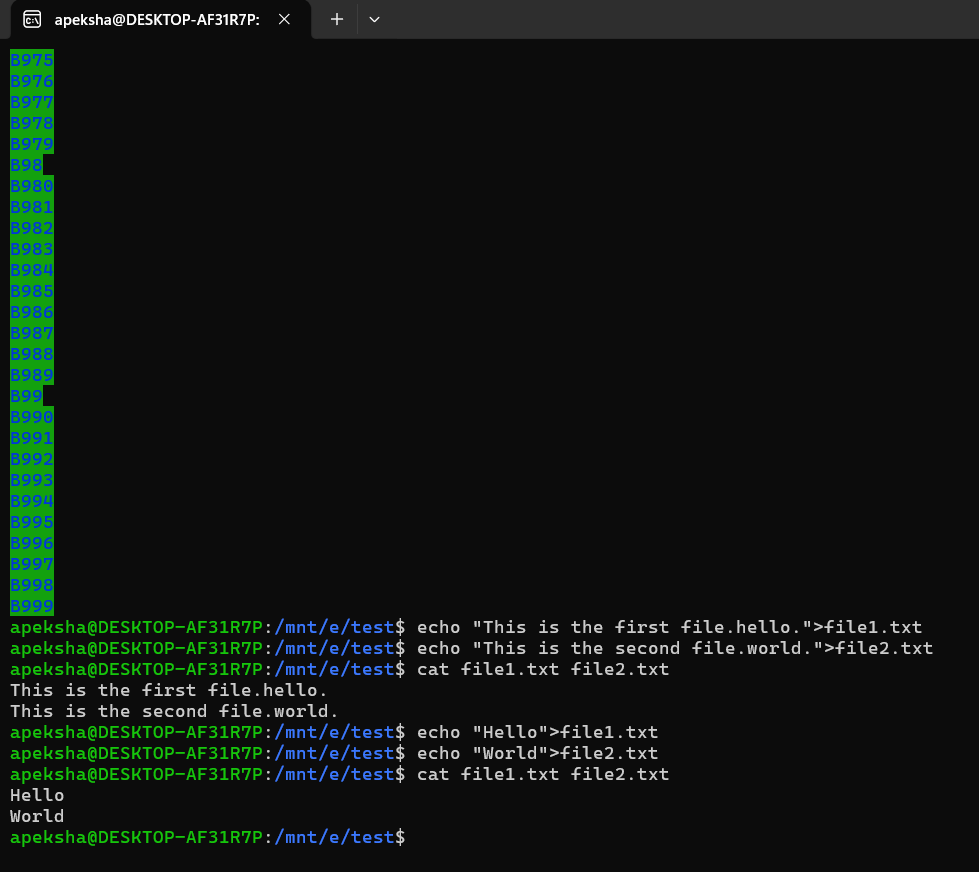
TASK 4: Get familiar with the command line on ubuntu and do the following subtasks
Familiarised myself with the Ubuntu commands like mkdir, ls, cd, pwd, echo. Create 2600 files and displayed them on the terminal. Also learnt how to concatenate two text files.
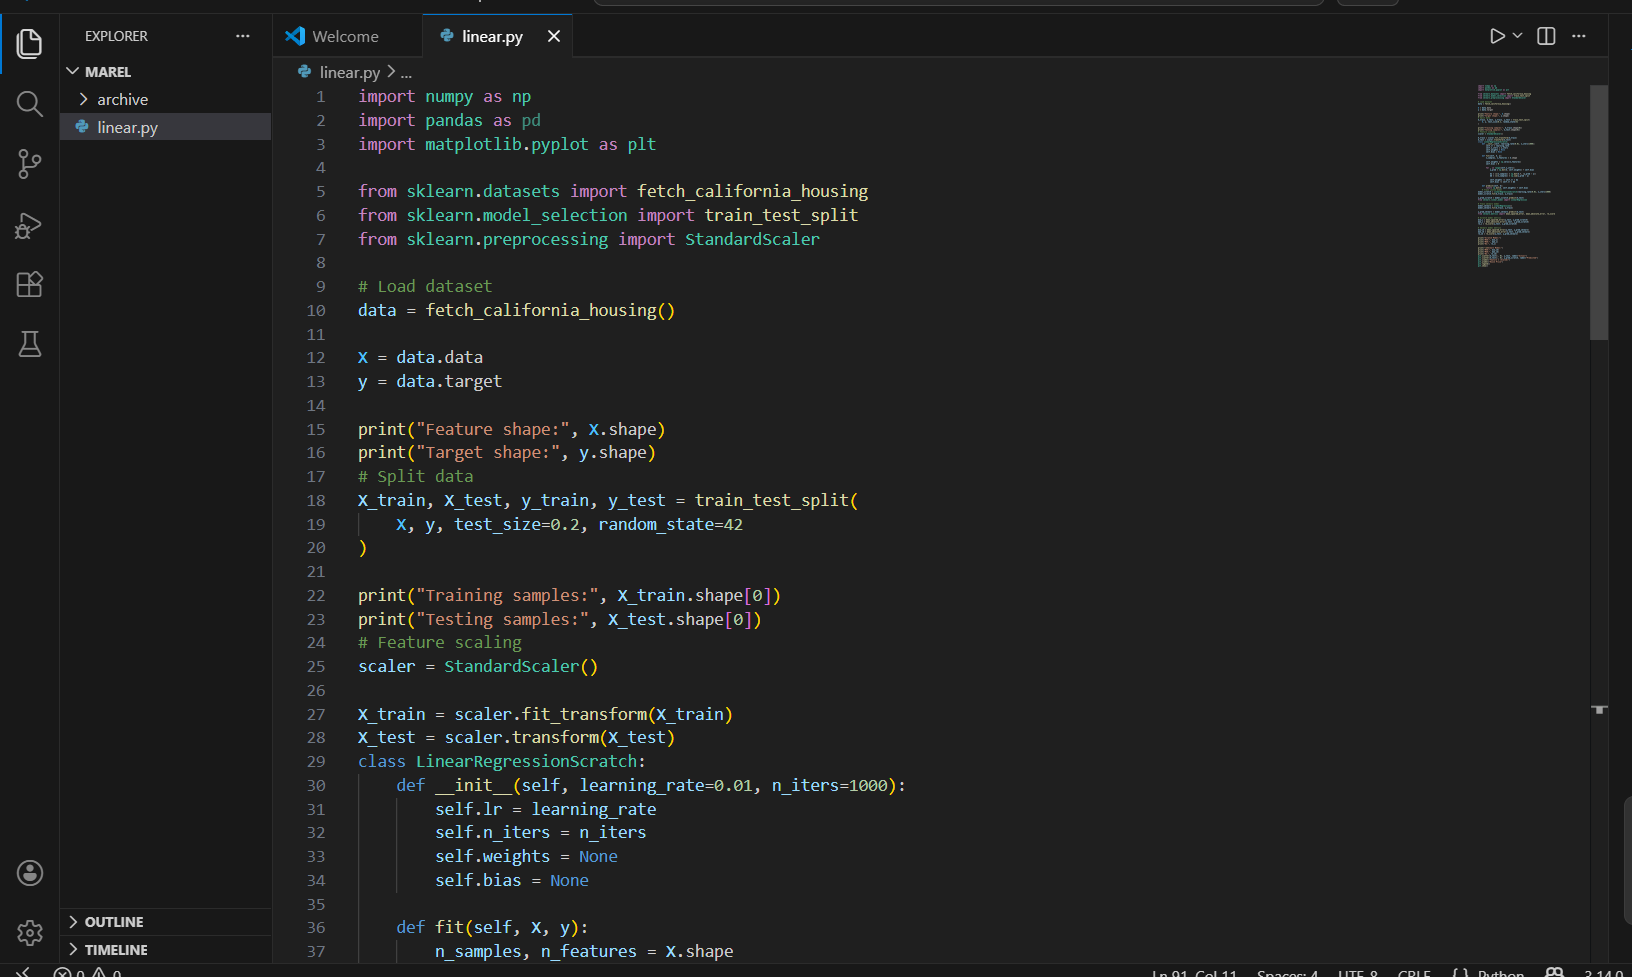
Task 5 : Build Your Own Brain -Linear Regression from Scratch
-
I learned how Linear Regression works internally by implementing the algorithm from scratch.
-
I understood how gradient descent updates weights and bias to minimize prediction error.
-
I learned the importance of feature scaling and choosing an appropriate learning rate for better model performance.
-
By comparing results with Scikit-learn, I understood how optimized libraries simplify machine learning implementation while giving accurate results.
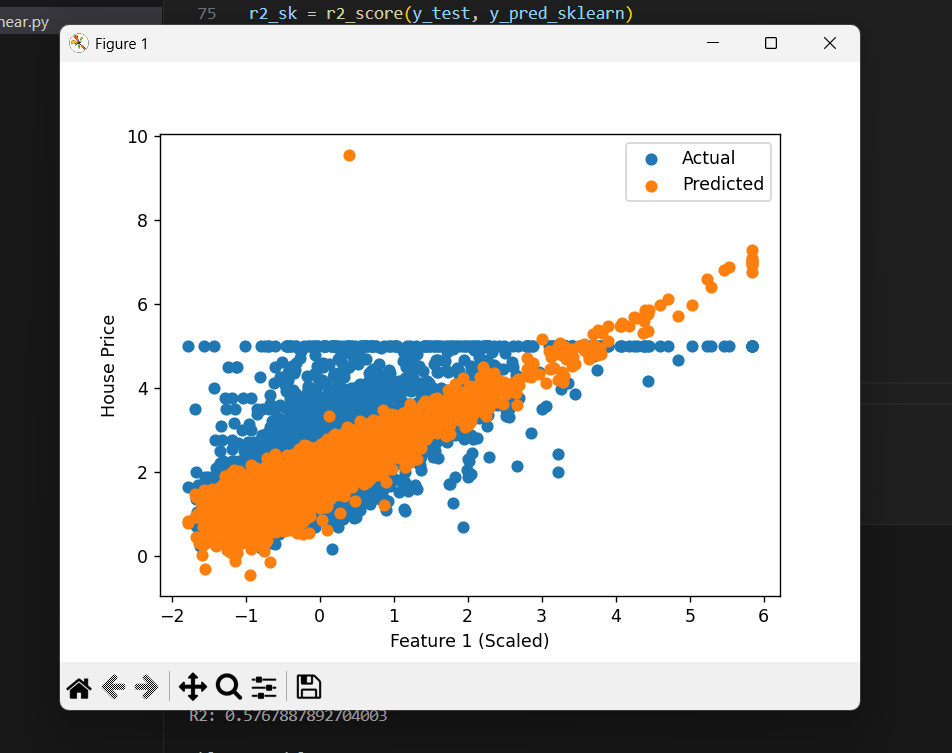
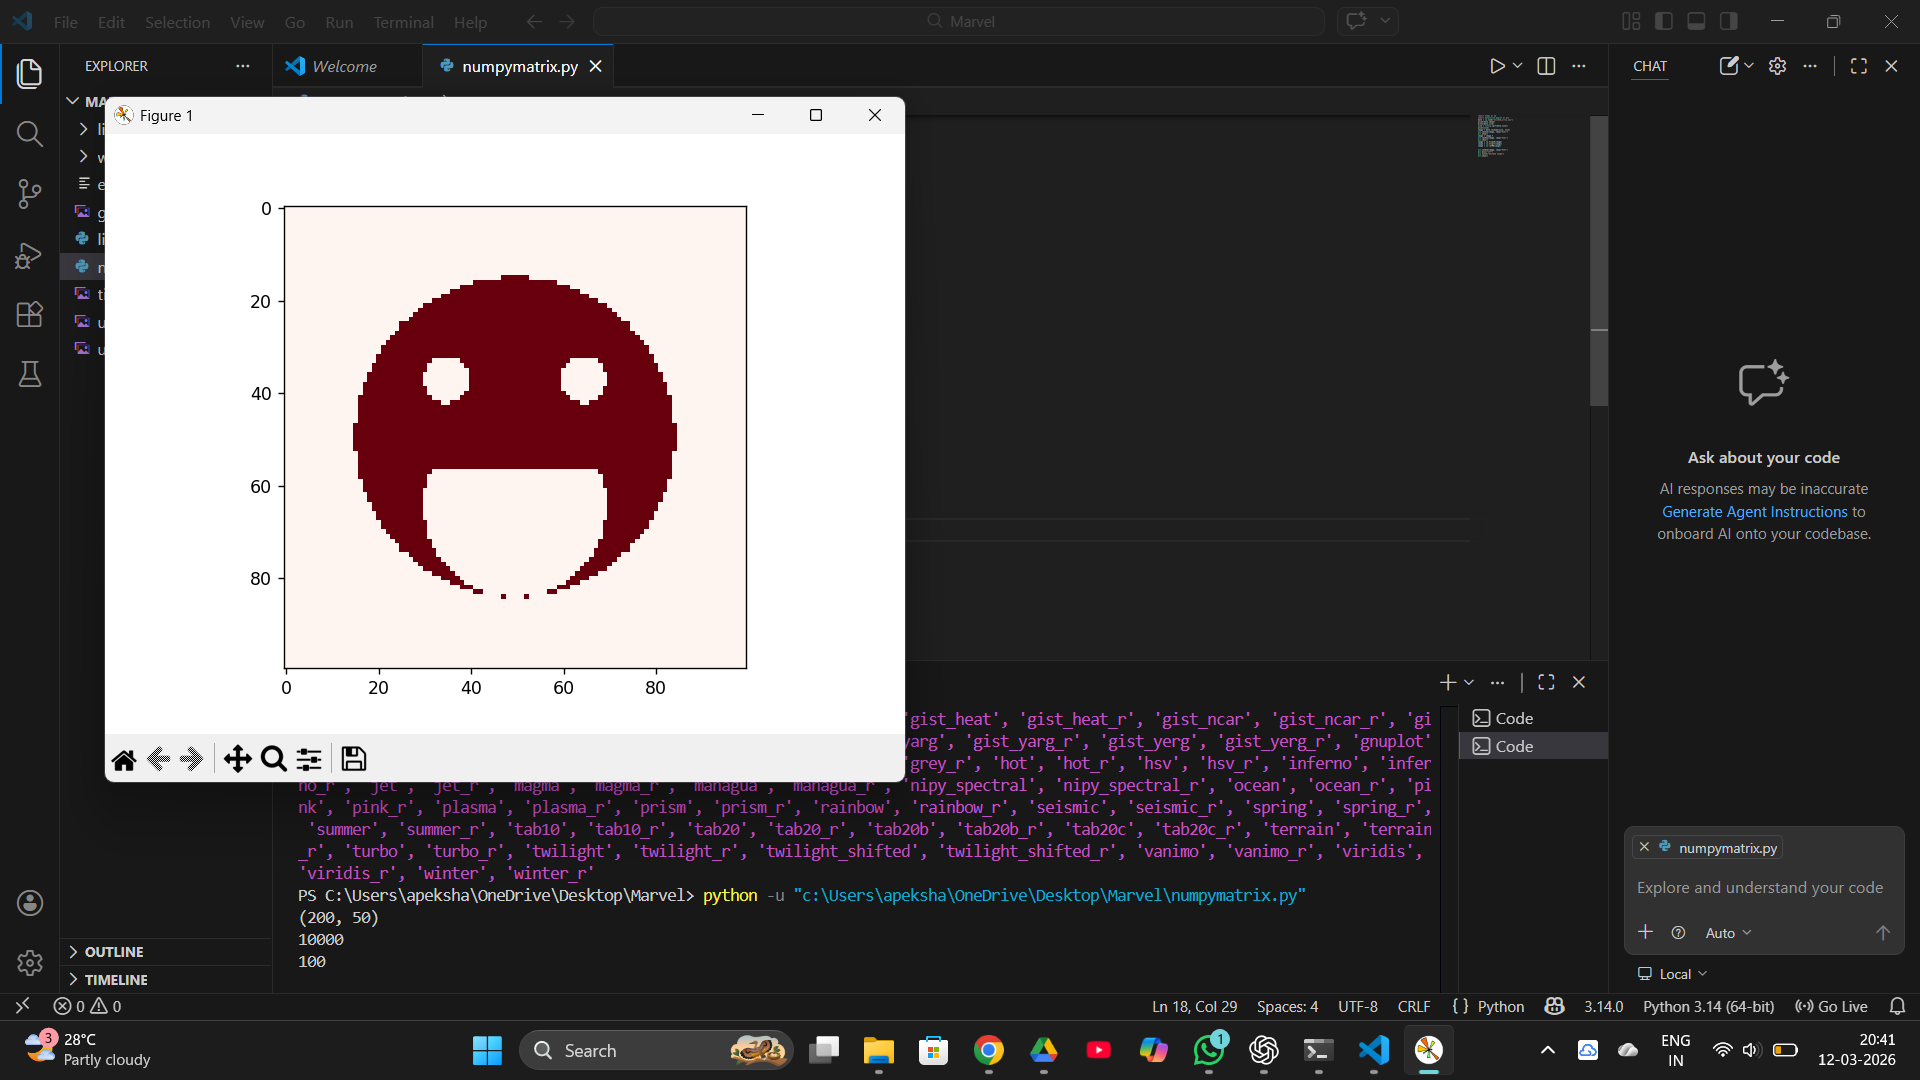
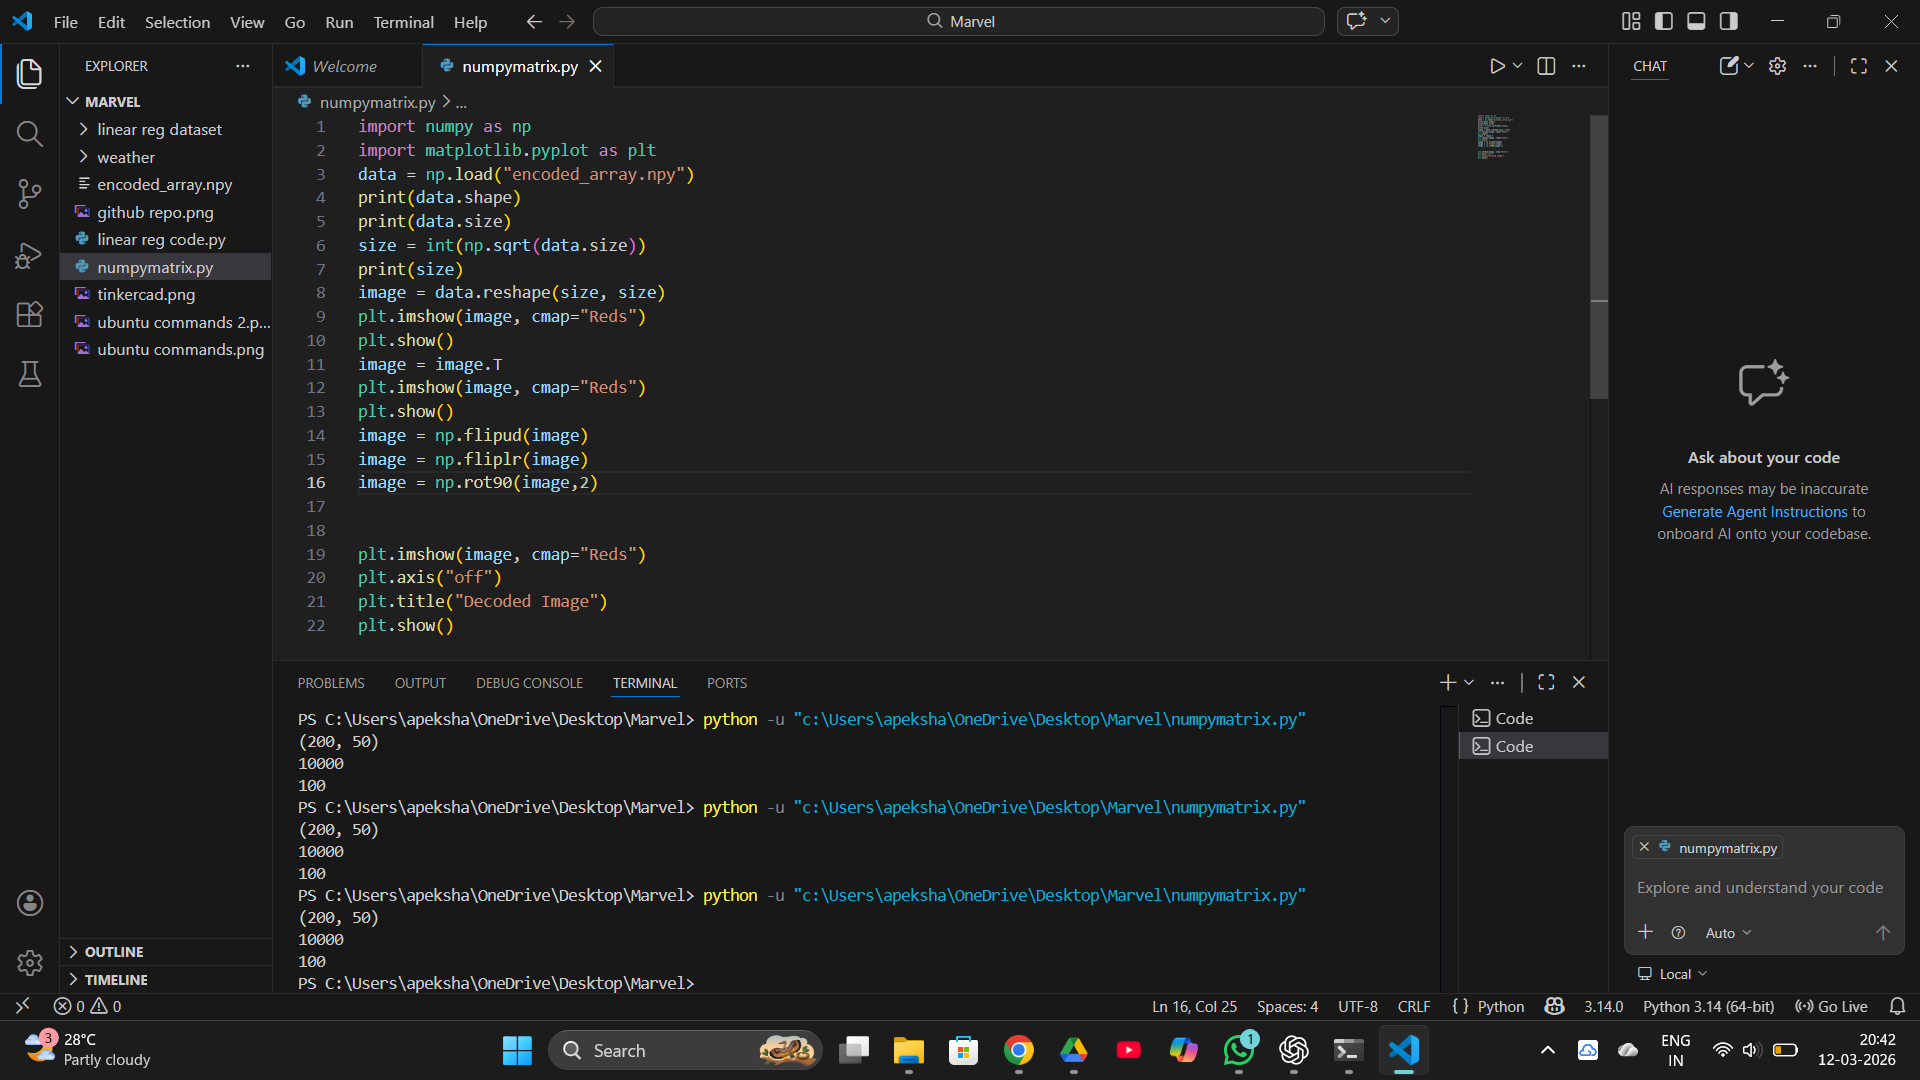
Task 6 : The Matrix Puzzle — Decode with NumPy & Reveal the Image
In this task, a scrambled matrix was decoded using array operations in NumPy. The matrix was reshaped into a square and manipulated using operations like transpose and flipping to correct its orientation. After rearranging the data properly, the hidden image was revealed using the imshow() function from Matplotlib. This task helped in understanding how numerical matrices can represent images and improved skills in array manipulation and visualization.
TASK 7: Create a Portfolio Webpage
Created a portfolio using HTML and CSS. Gained knowledge about different tags in HTML.
.png)
TASK 8: Writing Resource Article using Markdown
Wrote a resource article on quantum computing using markdown. Learned how to use markdown to write report and familiarised with it. Quantum computing
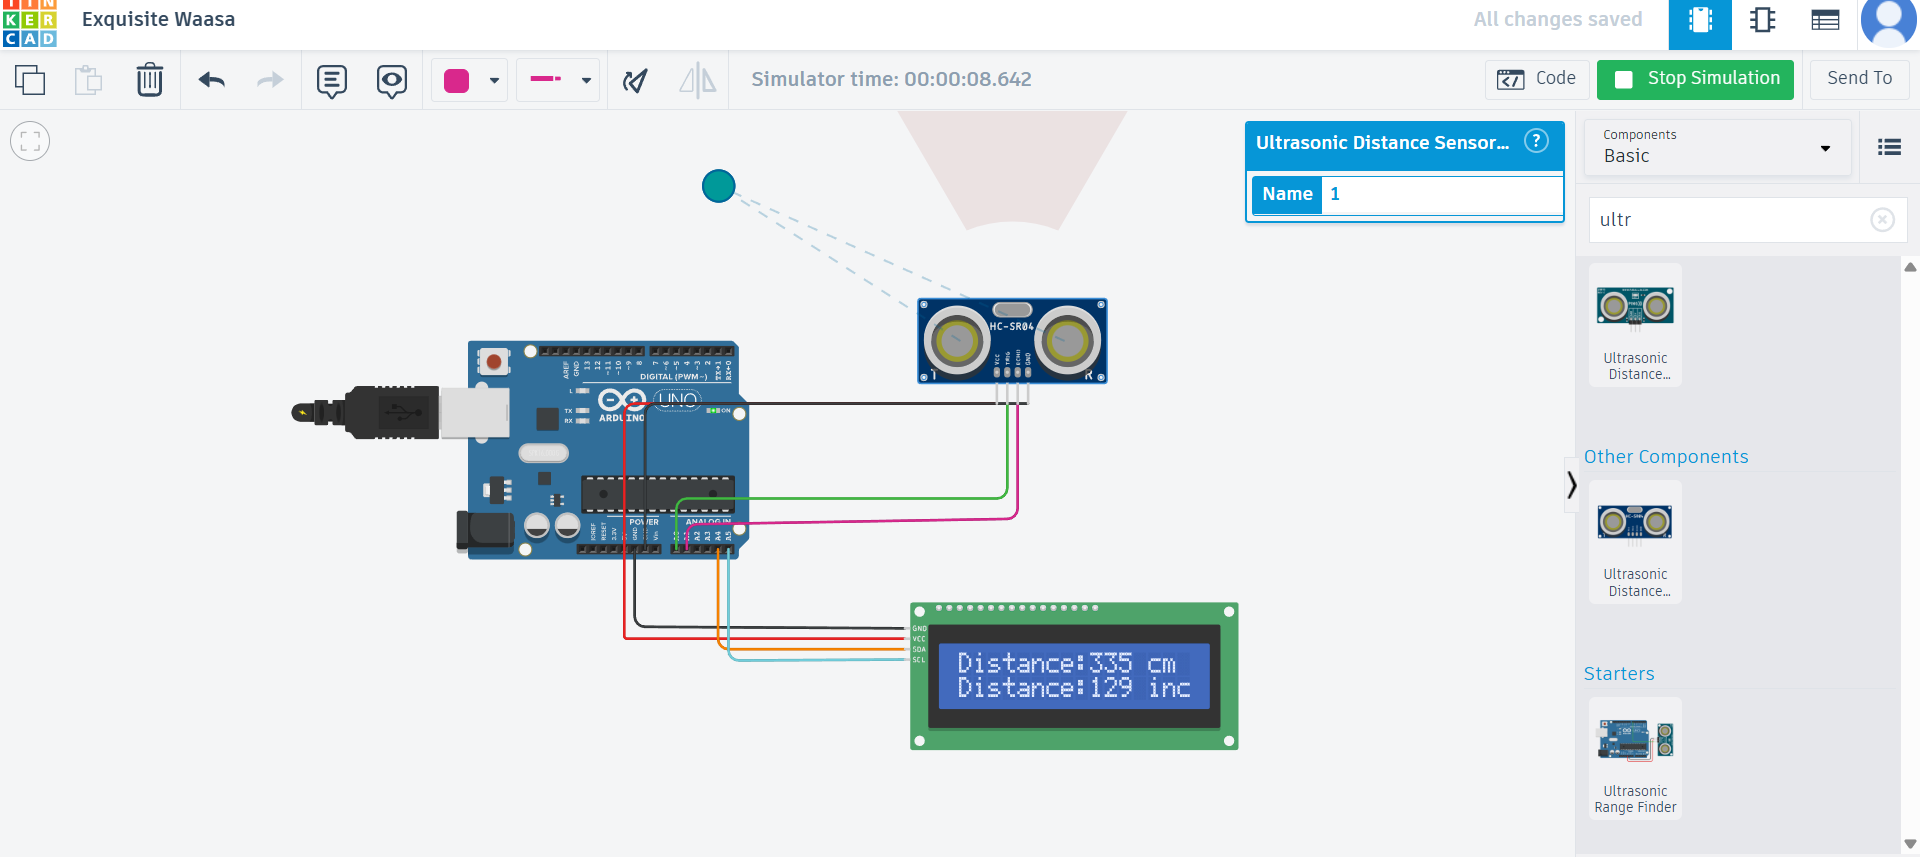
TASK 9: Tinkercad
Created a tinkercad account. Learnt to work with circuits. Previously I had worked with a similar simulator called Wokwi which made understanding this task better. Constructed a circuit using Arduino and ultrasonic sensor that measures distance from a obstacle and displays it on the LED.
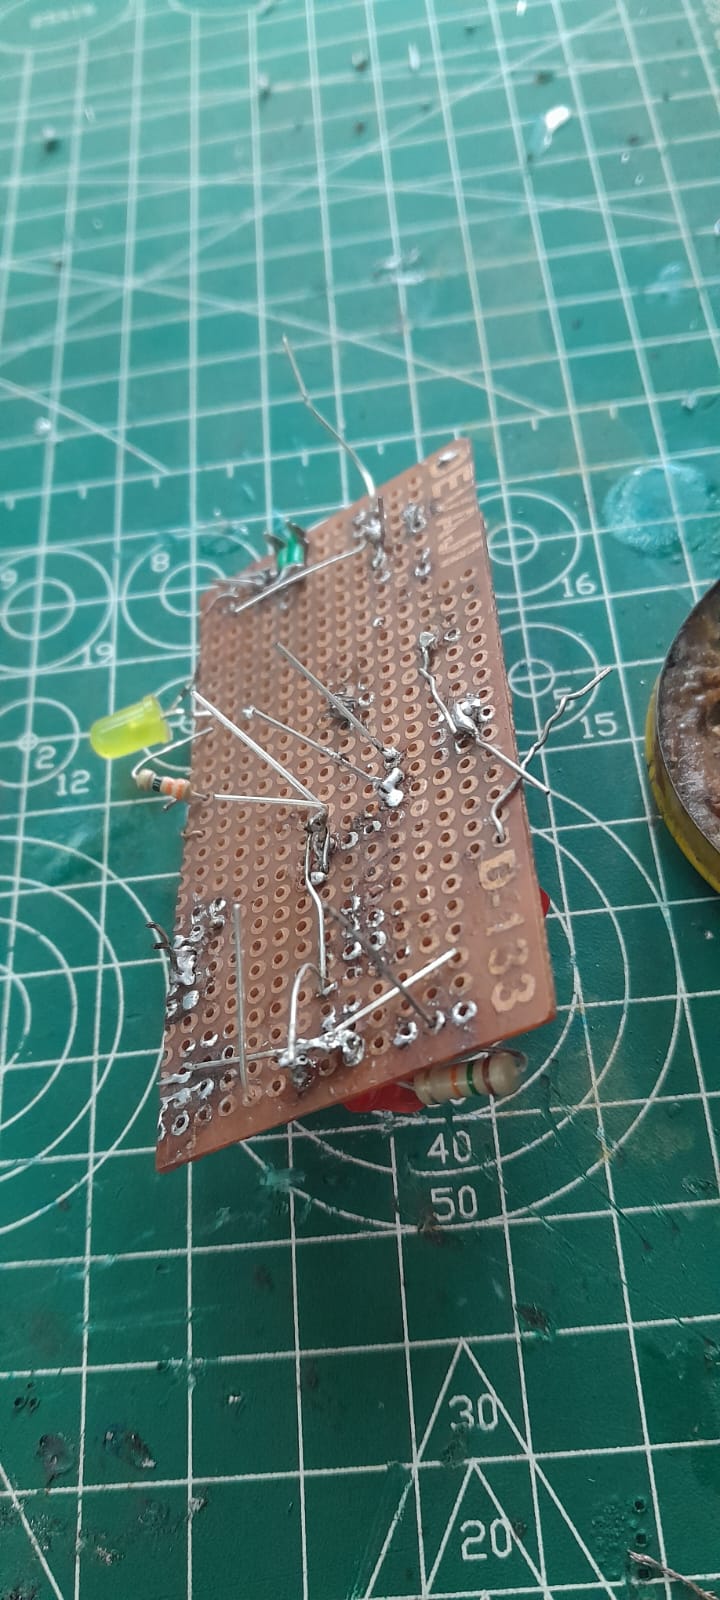
TASK 12: Soldering Prerequisites
Learned basic soldering and desoldering of LED on the perf board. Acquired knowledge about the different components used in soldering i.e, soldering iron, basic sponge, solder, soldering station.
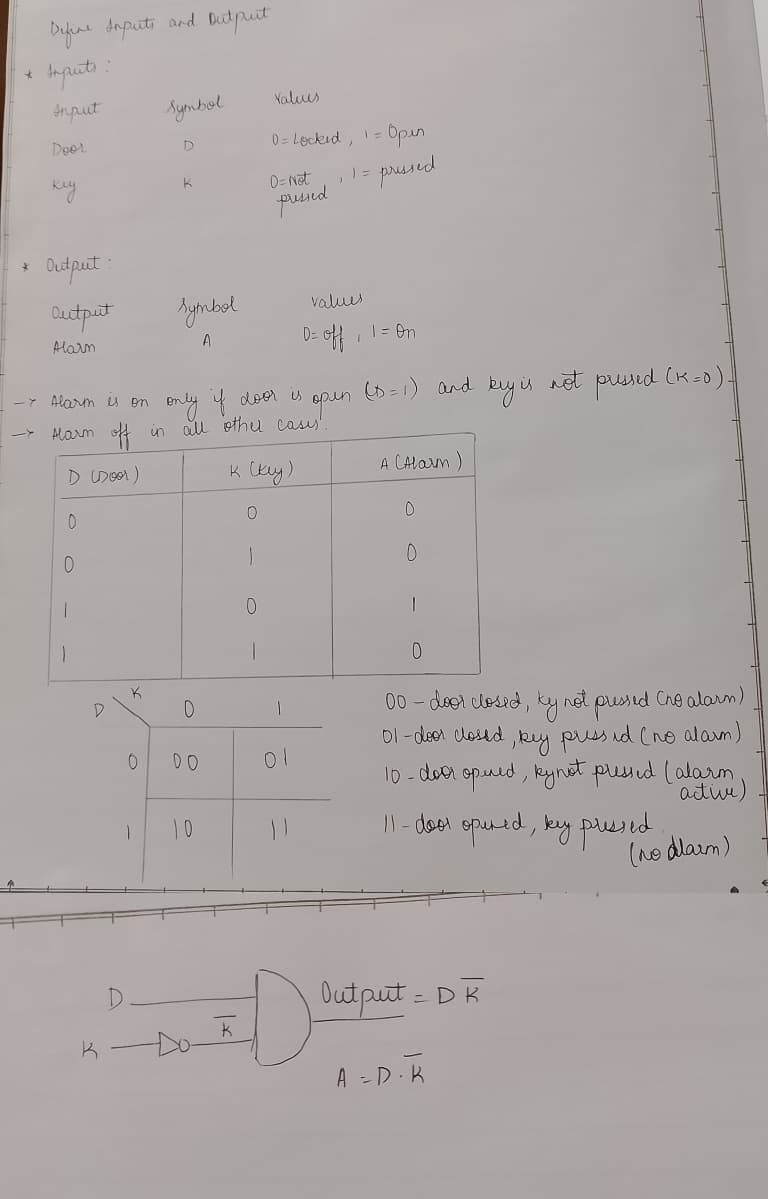
TASK 14: Karnaugh Maps and Deriving the logic circuit
A truth table shows all possible input combinations and the corresponding output. A Karnaugh Map is a graphical method to simplify Boolean expressions. It converts the truth table into a map so that common patterns can be grouped, reducing the number of logic gates needed. The task was to make a logic circuit for a burglar system, where the alarm must be active only when the door opens but key is not pressed.
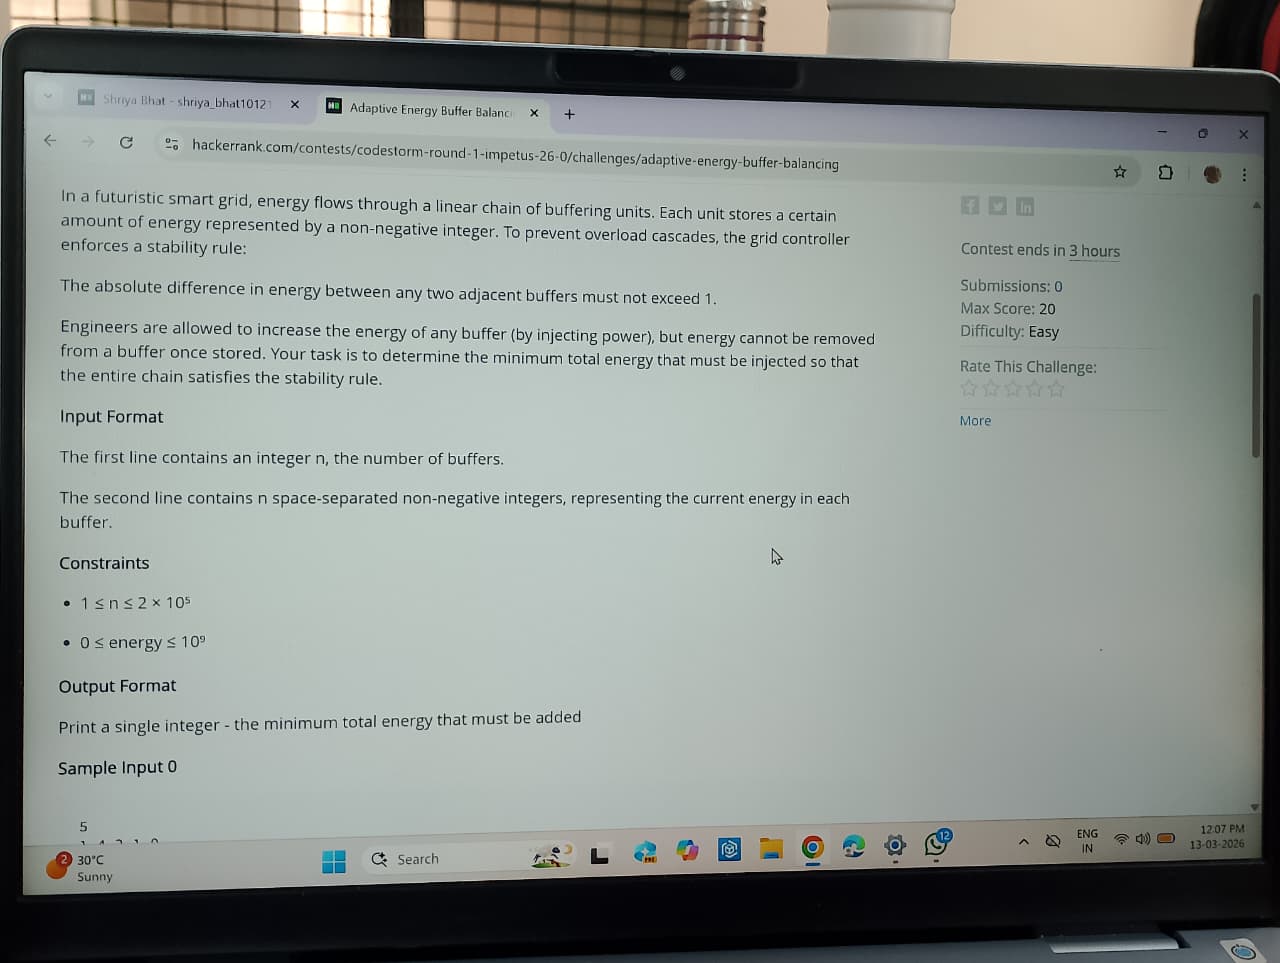
TASK 15: Active Participation
I partcipated in the event Codestorm held during IMPETUS 26.0. I am yet to receive the participation certificate. Will update once I recieve it.
TASK 16 : Datasheets report writing
Wrote a report about the MQ135 Gas sensor using markdown . Click here for the report.
Task 17: Introduction to VR
Made a report on the topic Virtual reality and differences between VR and AR. Click here for the report.
Task 20 : Notebook Ninja – Getting Started with Jupyter
In this task, I got introduced to Jupyter Notebook and how it can be used for both coding and explaining ideas in one place. At first, it was a bit confusing to switch between Markdown and code cells, but as I practiced, I started understanding how everything works together.
I learned how to use Markdown to organize my notebook with headings, bullet points, and even images, which made it look much cleaner and easier to read. Along with that, I wrote some basic Python code to perform simple calculations and created a graph using Matplotlib. Seeing the output and visualization directly below the code made the learning process more interactive.
Overall, this task helped me become more comfortable with Jupyter Notebook and showed me how important it is to present work in a clear and structured way, not just write code. Click here for the notebook.
Task 21: Watch & Reflect – Intro to Machine Learning
You can find the link to the report based of the vidoes here