PROJECT
Crowd Safety Analyzer
| Sahithi Reddy | AUTHOR | ACTIVE |
| Varsha Shubhashri.M | COORDINATOR | ACTIVE |
Crowd Safety Analyzer
MARVEL GPP 2026 — Project Report
| Systems Architect | Desam Sahithi Reddy |
| Technical Lead | Kushal Kumar J |
| Frontend / UX Lead | Lalremruata Ralte |
| Project Guide | Varsha Shubhashri M |
| Repository | github.com/nonsensicalraven/crowd-safety-analyzer |
Executive Summary
In 2024–25, 237 people died in stampedes across India. In every case, organisers had no live, localised view of where the crowd was becoming dangerous. The Crowd Safety Analyzer watches a video feed of a venue, detects people using AI, groups them into crowds, and scores each of six venue zones from safe to critical. Alerts persist to a database and stream to a live dashboard. We've built and demonstrated the full pipeline end-to-end on recorded video. Live camera validation is the next step.
1. Why We Built This
India's crowd disasters are not rare. Hathras, the Maha Kumbh, New Delhi Railway Station — three incidents in eighteen months, over 160 deaths. The pattern is always the same: crowds reach densities where people cannot control their movement, and by the time anyone notices, it's already a crush.
Density and not headcount is what kills. A plaza with ten thousand people spread out is safe. A corridor with eighty people packed in is not. Existing systems either count people or record footage for after-the-fact review. Neither answers the question an organiser actually needs answered: which specific part of this venue is becoming dangerous, right now?
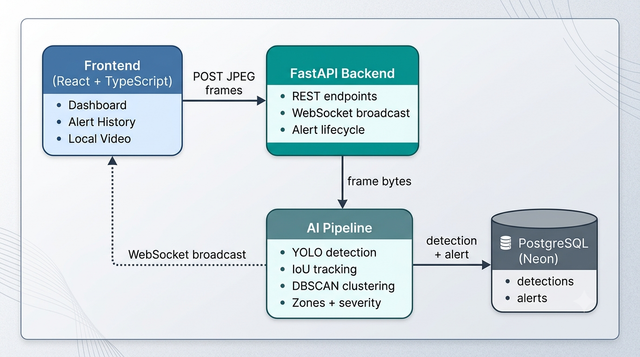
Figure 1: The system, end to end. Frames flow from the browser into the backend, through the AI pipeline, and results are persisted and broadcast back to the dashboard live.
2. What We Set Out to Build
Our original proposal was ambitious: a fully offline, on-device system that would run on a single laptop, detect dangerous crowd patterns in real time, and require no internet. The stack included YOLOv8-nano for detection, DBSCAN for clustering, optical flow for surge detection, FastAPI for the backend, PostgreSQL for persistence, and a React dashboard with predictive components.
Some of that shipped. Some didn't.
3. What We Actually Built
A user loads a video from the dashboard. The frontend captures frames and uploads them to a FastAPI backend. Each frame runs through the AI pipeline: YOLO detects heads, a tracker links detections across frames, DBSCAN groups nearby people into crowds, and each crowd is assigned to one of six zones. Density is computed per crowd, and each zone gets a severity — LOW, MEDIUM, HIGH, or CRITICAL. Every processed frame is written to a detections table; alert-worthy readings create or update rows in an alerts table. Both live in PostgreSQL on Neon. Simultaneously, the backend broadcasts each update to connected dashboards over WebSocket.
The dashboard renders six zone cards, a live alert board, and an Alert History page with lifecycle actions — acknowledge, response-team-arrived, cleared.
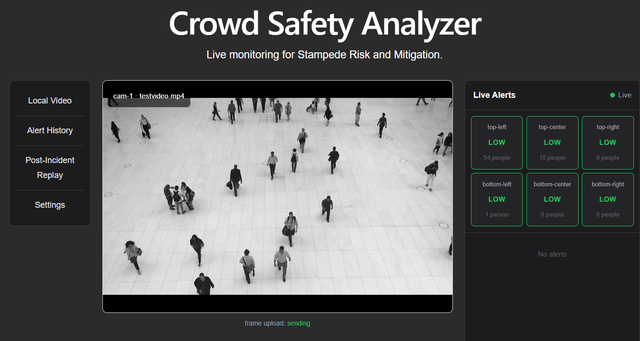
Figure 2: The live dashboard. Six zone cards on the right update in real time as the video plays; alerts appear on the Live Alerts board as zones cross severity thresholds.
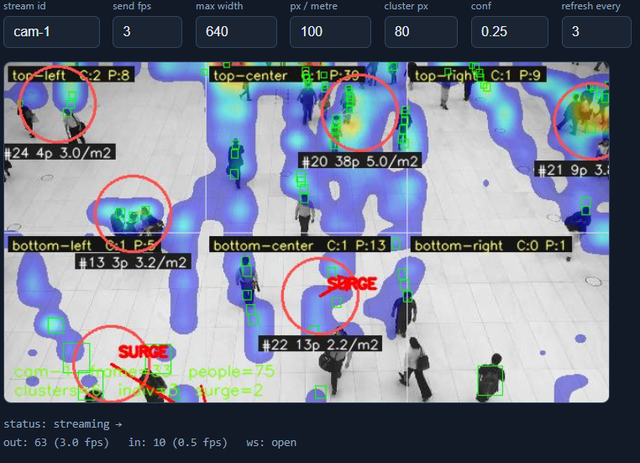
Figure 3: A single frame after processing. Green boxes mark detected heads; red circles mark clusters and label their density; white lines show the 3×2 zone grid.
4. The Decisions That Shaped This Project
Six Zones
One severity for the whole frame is not useful. Too many zones produce alert noise and an operator who sees twenty alerts a minute gets overwhelmed. We chose a 3×2 grid: six zones, mapped naturally onto how a venue's camera view is laid out. The grid dimensions are frozen at server startup and the backend refuses to boot if anyone changes them without updating the frontend contract too.
Members of a single crowd within a zone can occupy two adjacent cells. Rather than splitting the cluster, we count members per cell and assign the whole cluster to the majority cell. A cluster is never split. Density numbers stay honest.
Clustering — DBSCAN and the Epsilon Problem
To measure density, you must first group people.Hence we used DBSCAN since it doesn't need you to specify how many clusters exist, and it handles the irregular shapes crowds form.
But DBSCAN has one critical parameter — the maximum distance between two points for them to count as neighbours. Set it too small and every person becomes their own cluster. Too large and the whole venue collapses into one blob. We set the default at 80 pixels, which suits wide shots, and exposed it as a per-stream query override. There is no universally correct value. It depends entirely on camera distance.
Pixels Per Metre
Density is people per square metre. That requires knowing how many pixels represent one metre. For a fixed camera at a known distance, this is measurable. For arbitrary uploaded video, there is no correct value.
We set the default to 100 and exposed it as an override. Our density numbers are internally consistent — denser crowds always report higher but they are not physically absolute unless the operator calibrates.
Heatmap
The heatmap overlay uses exponential decay. Without it, a hot spot from ten minutes ago would still glow at full intensity, misleading operators about current conditions. Decay makes the visualisation forget old activity at roughly the rate crowds move.
Latency
Our proposal cited 97 frames per second for YOLO inference. The full pipeline — decoding, detection, tracking, clustering, zone assignment, database writes, WebSocket broadcast — runs at roughly 6 to 7 frames per second end to end. The 97 fps figure was raw inference on an unloaded GPU. Unfortunately, we couldn't reach such high fps without compromising accuracy.
We made a choice that the frontend will send frames at about 2 per second. A dashboard that updates every half second is indistinguishable from one that updates ten times a second since human operators can't act on thirty updates a second anyway. Dropping frames keeps the pipeline accurate and fast. Every frame we send is fully processed.
Alerts as Events and Not Rows
Some systems writes one alert row per dangerous frame. Two minutes of a critical zone at 2 fps would produce 240 rows of noise. Instead, our alert logic treats readings as one ongoing event: the first creates a row, later readings extend its duration, escalations update severity in place. Alerts are keyed on (stream_id, zone), so a HIGH in top-left can't accidentally merge with a HIGH in bottom-right. Acknowledging or clearing closes the event, and the next dangerous reading starts fresh.
5. Testing and Results
We tested multiple pre-recorded videos with no camera movement. Clustering behaved as expected with one large cluster at default epsilon on the dense image and multiple smaller ones when we reduced it. Alerts fired on all four ingestion endpoints. The alert lifecycle updated the database correctly and closed the event tracker. The dashboard rendered live updates without visible lag.
6. What We Haven't Built Yet
- Live camera validation. The pipeline is frame-source agnostic, but we've only demonstrated on recorded video. Webcam testing is planned.
- Optical flow for directional surge. Surge is stored and displayed but doesn't influence severity yet.
- A post-incident events table. Currently only
detectionsandalertsexist. Acknowledge and clear update the same row — there's no separate audit log. - Predictive UI — trend arrows, density countdown, confidence indicators.
- Docker packaging and offline-first deployment.
7. Learning Outcomes
Kushal Kumar J (Technical Lead) — Working with YOLOv8 on real crowd imagery, learning the difference between raw inference throughput and full-pipeline throughput, and understanding why clustering parameters must be exposed rather than fixed.
Desam Sahithi Reddy (Systems Architect) — Designing a FastAPI backend with both REST and WebSocket interfaces, structuring schemas around event continuity rather than raw frame counts, and reasoning about fallback behaviour when components fail.
Lalremruata Ralte (Frontend / UX Lead) — Building a real-time React dashboard driven entirely by WebSocket messages, handling reconnecting clients gracefully, and designing for crisis response where clarity beats decoration.
Team-wide — Building an integrated system where every layer assumes the others work, and learning that the constraints that matter most are rarely in the code. They're in the physics of the hardware, the latency of the network, and the limits of human attention.
8. Links
- Repository : github.com/nonsensicalraven/crowd-safety-analyzer
- Model:
AmineSam/irail-crowd-counting-yolov8n(Hugging Face) - Stack: FastAPI, Ultralytics YOLOv8, scikit-learn, OpenCV, React, Vite, PostgreSQL