MARVEL AIML Level 1 Tasks Report (Monthly)
20 / 3 / 2025
Nithish N S - AIML Level 1 Tasks Report
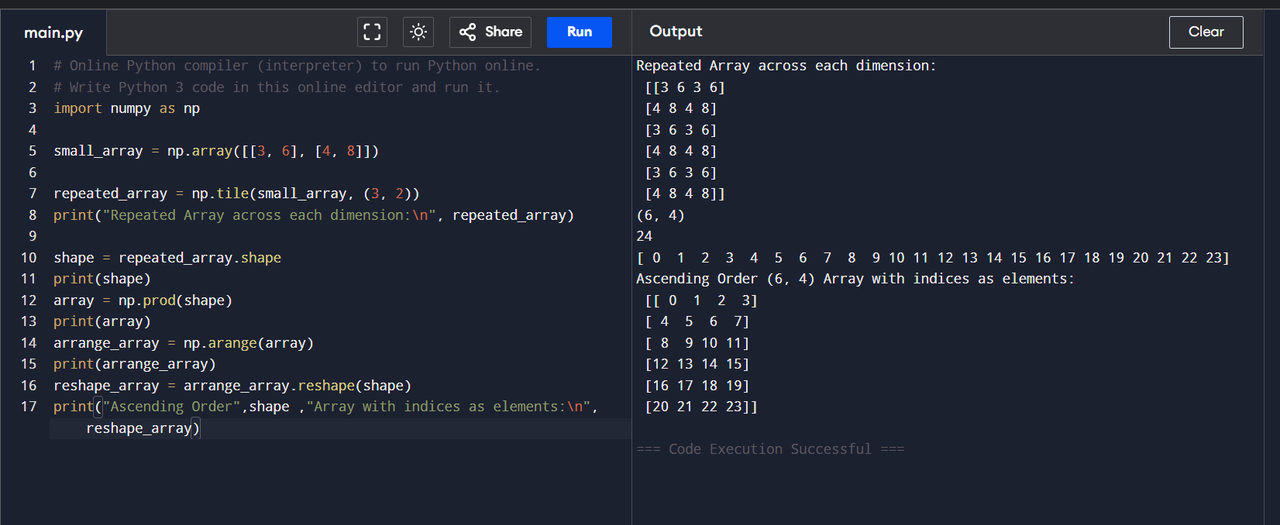
TASK 1: Numpy
I used numpy for efficient array manipulation, including repeating , reshaping , and generating sequences. The shape function retrieves array dimensions, while the prod(shape) computes total elements for reshaping and arange() creates a sequential array. Numpy improves speed, memory efficiency, and eliminates the need for loops.
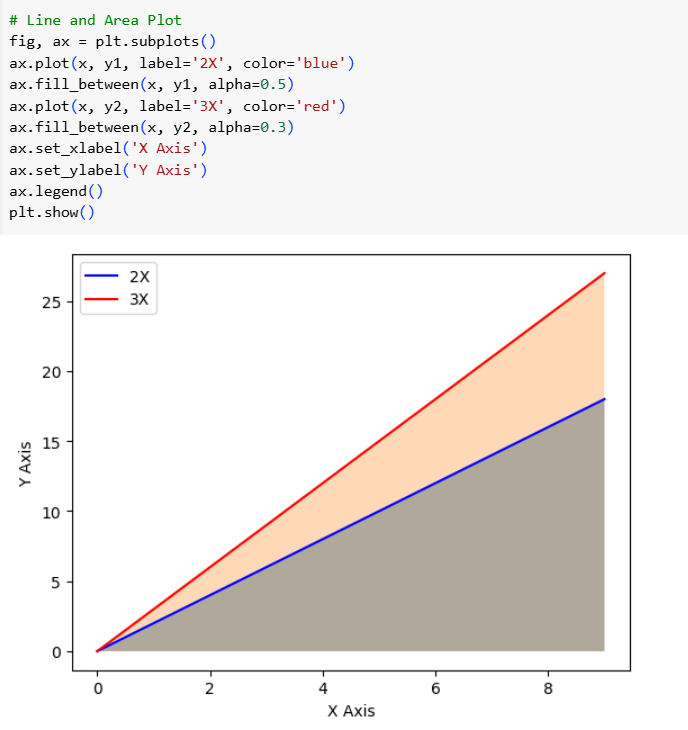
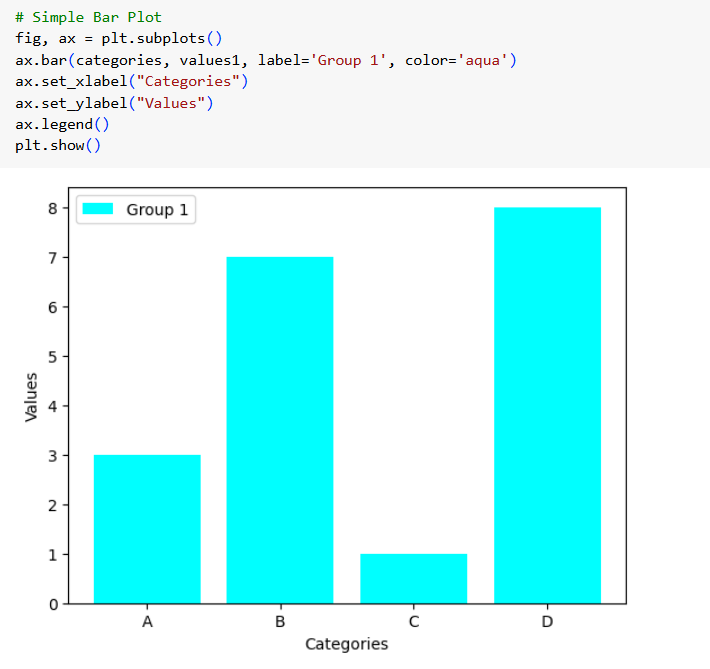
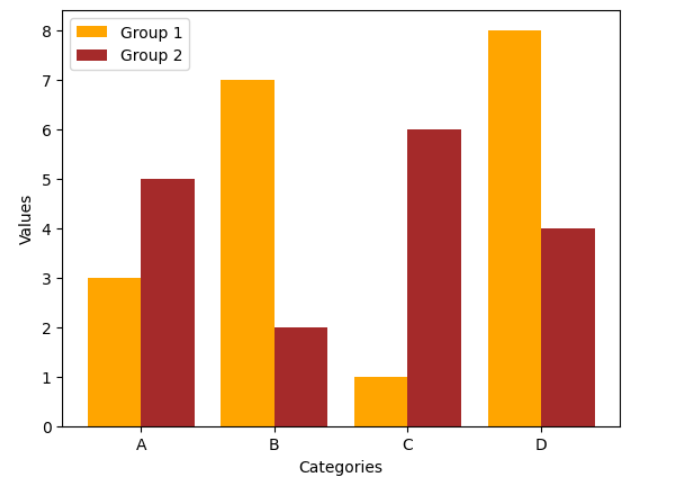
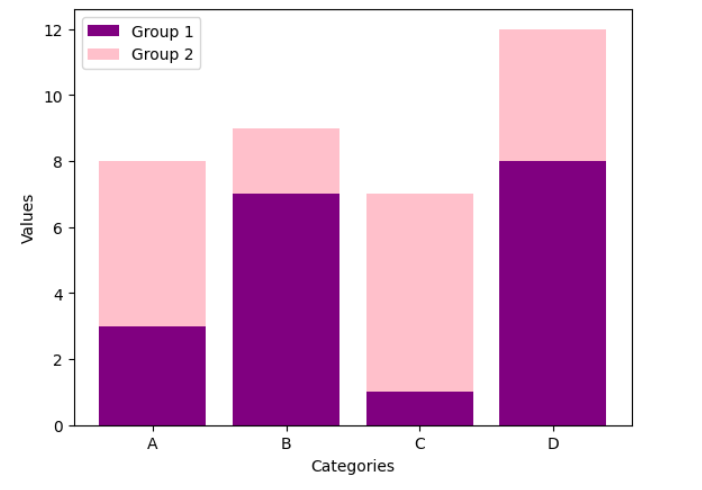
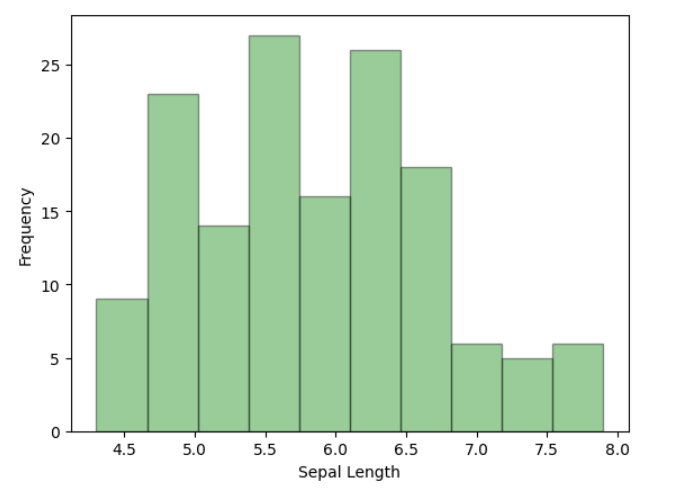
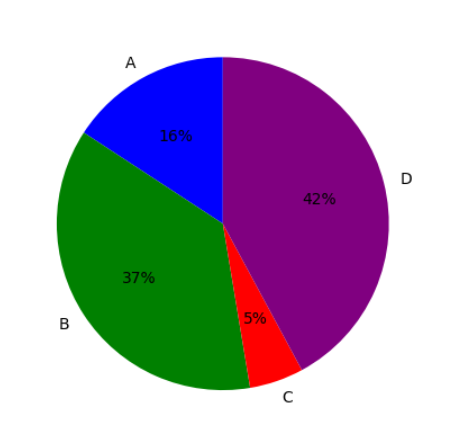
TASK 2: Matplotlib and Data Visualisation
I used matplotlib for quick and flexible data visualization. It helps create simple plots, like line and bar charts, with full control over labels, colors, and legends. It integrates well with numpy and forms the base for advanced libraries like seaborn. My key learning is that matplotlib is great for basic plotting, while seaborn enhances aesthetics and statistical insights.
TASK 3: Linear and Logistic Regression - HelloWorld for AIML
Linear Regression
In linear regression, I learned how the cost function helps measure prediction errors, and how algorithms like gradient descent achieve convergence. I understood the role of learning rate in controlling the speed and stability of training. To evaluate models, I explored performance metrics like R² and adjusted R². I also grasped the importance of avoiding overfitting and underfitting for better generalization.
Logistic Regression
In logistic regression, I learned how the sigmoid function is used for squashing outputs between 0 and 1. I understood the cost function that helps measure classification error. I explored performance metrics like the confusion matrix, including true positives, true negatives, false positives, and false negatives. I also learned to calculate precision, recall, and the F1-score to evaluate model performance.
TASK 4: Metrics and Performance Evaluation
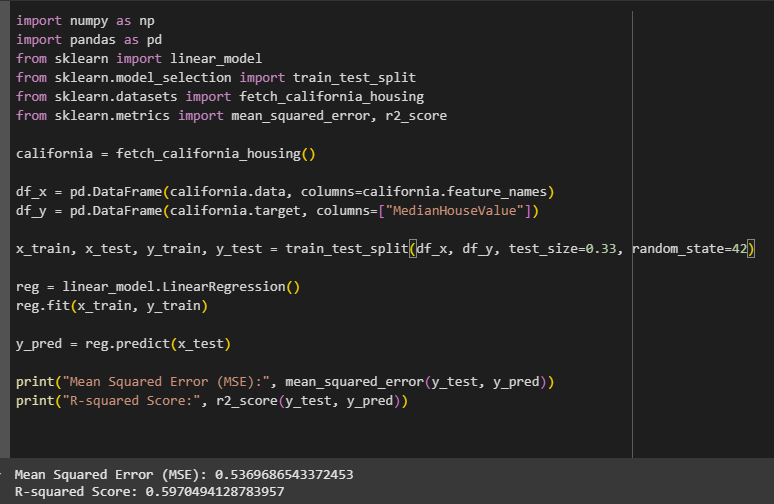
Regression Metrics
In regression, I evaluate how well my model predicts continuous values.
- Mean Absolute Error (MAE): It tells me the average difference between the predicted and actual prices.
- Mean Squared Error (MSE): This squares the errors, so bigger mistakes are penalized more.
- Root Mean Squared Error (RMSE): It gives me the error in the same unit as house prices.
- R-squared (R²): This shows how much of the price variation is explained by my model.
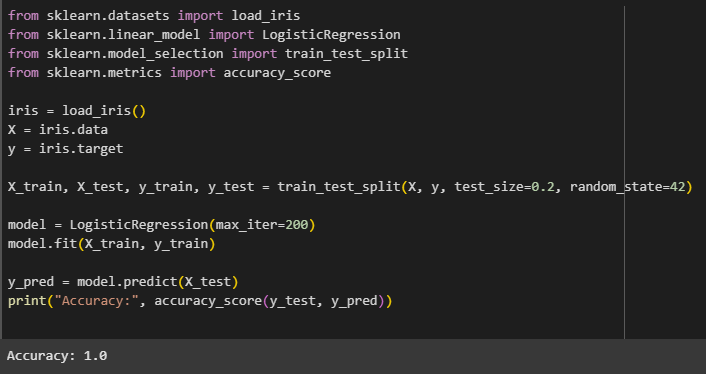
Classification Metrics
In classification, I measure how accurately my model predicts categories or class labels.
- Accuracy: It tells me the overall correctness of my model.
- Precision: It shows how many of my positive predictions were actually correct.
- Recall: It helps me understand how well I’m capturing the actual positive cases.
- F1 Score: It balances precision and recall for a more reliable performance measure.
- Confusion Matrix: It gives me a clear breakdown of true and false positives and negatives.
TASK 5: An elementary step towards understanding Neural Networks
Neural Network
Imagine a neural network as a learned function that predicts, based on how the human brain functions.
Simple Analogy:
Visualize a system of light switches (neurons). Each switch receives some electricity (input), makes a tiny decision (weights + bias), and sends it down. Lots of switches in layers collaborate to determine what the ultimate light (output) should be.
Main Concepts:
- Neuron: One thing that accepts inputs, scales them with weights, adds a bias, and activates.
- Weights: Values that indicate how significant every input is.
- Activation Function: A function which determines whether the neuron fires or not.
- Layers:
- Input layer: Accepts raw data.
- Hidden layers: Performed computations.
- Output layer: Produces end result (say, cat or dog).
ANN (Artificial Neural Network)
It is employed for numbers or word data (e.g. predicting prices, detecting spam)
Structure: Input → Hidden Layers → Output
Thinks like: A calculator working problems in stages.
CNN (Convolutional Neural Network)
It is employed for images and visual information (e.g. facial recognition, image classification)
Structure: Convolution → Pooling → Dense Layers
Thinks like: An eye that acquires patterns in pictures.
How Large Language Models Such As GPT-4 Work
A language model is a form of artificial intelligence that can comprehend and create human language. If you've ever chatted with ChatGPT, you're conversing with a large language model (LLM).
GPT-4 (Generative Pretrained Transformer 4) is a very large language model trained on huge amounts of text from books, websites, and conversations.
- Answer questions
- Write essays and code
- Translate languages
- Understand images (in newer versions)
Building GPT-4 is very complex, but let's simplify it into 5 simple steps:
Collect a Huge Amount of Text Data
To train a model such as GPT-4, you require a tremendous amount of text consider
- Books, articles, websites, Wikipedia
- Code, math, even forum dialog
This serves to allow the model to "read" the world and become educated on the nature of language.
Construct the Transformer Architecture
GPT-4 employs what's known as a Transformer, a type of neural network for processing sequences (such as sentences). It functions by:
- Tokenizing text (cutting text up into pieces of words)
- Understanding how words are connected with each other through attention (e.g. "The cat sat on its mat" → who is its?)
Pretrain the Model
The model now learns by predicting the next word in a sentence. For instance:
Input: "The sun rises in the…" Target: "east"
It does this millions or billions of times, slowly tweaking its internal math (weights) to get better.
Fine-tune and Align
After pretraining, the model is fine-tuned to better execute instructions. This could involve:
- Additional training in dialogue and question-answering
- Reinforcement Learning from Human Feedback (RLHF) — where humans sort model responses to assist it in learning behavior
Scale It Up
GPT-4 has hundreds of billions of parameters (such as the "settings" within the model). More parameters means more brainpower, yet it also implies:
- More GPUs (graphics cards)
- More memory and computing time
- Enormous energy and financial expenses
Tools You'd Need
- High-performance servers with GPUs (such as NVIDIA A100s)
- Billions of words of training data
- ML libraries such as PyTorch or TensorFlow
- Huge distributed training infrastructure
TASK 6: Mathematics behind machine learning
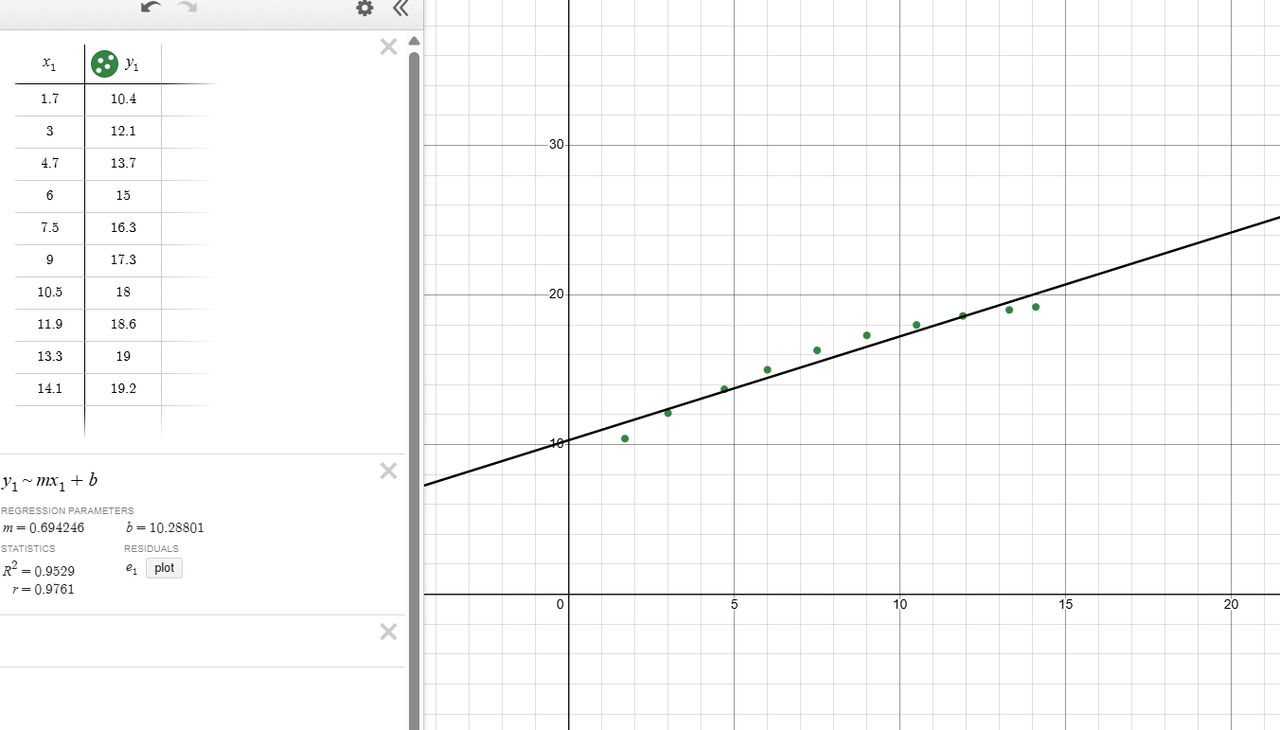
Curve Fitting
I plotted a set of data points and used a linear regression to find the best fit line that represents the trend.
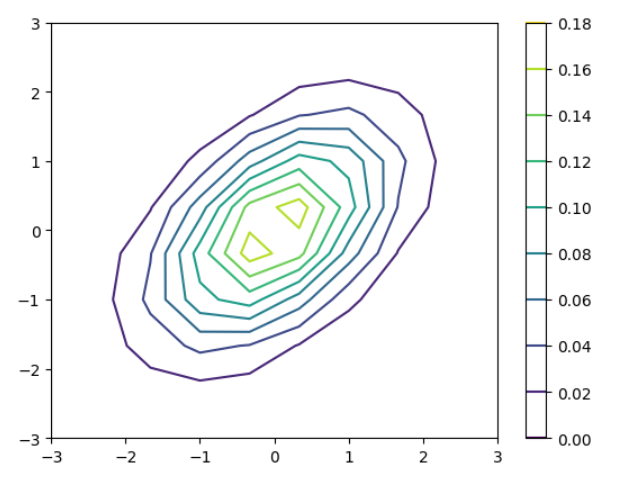
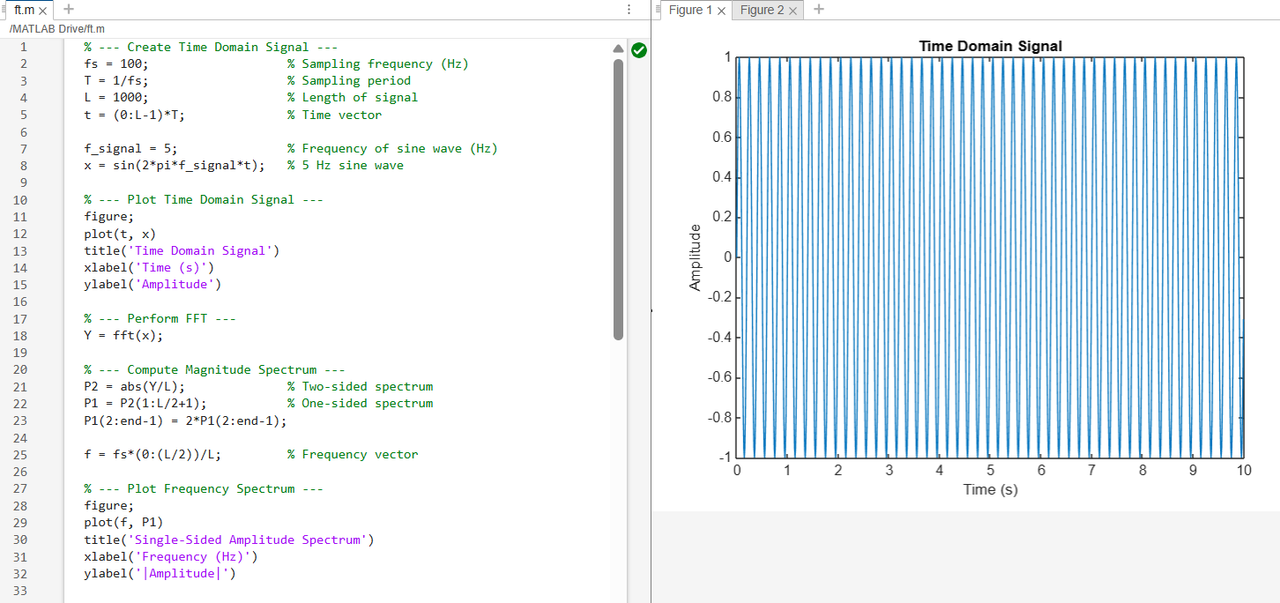
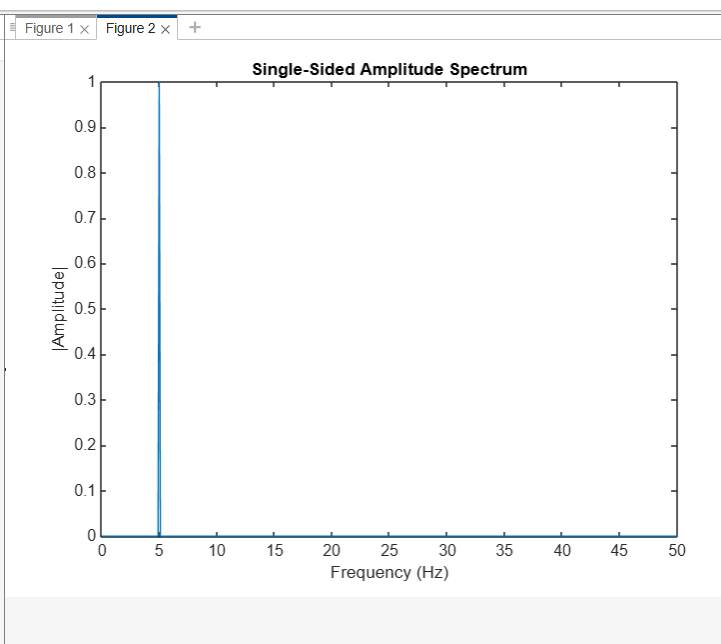
Fourier Transforms
First, it generates a 5 Hz sine wave in the time domain. Next, it employs the Fourier Transform (through fft) to examine that signal. This provides the frequency content of the signal. Lastly, it plots the frequency spectrum, which indicates a peak at 5 Hz, which verifies the signal has that frequency.
TASK 7: Linear and Logistic Regression - Coding the model from SCRATCH
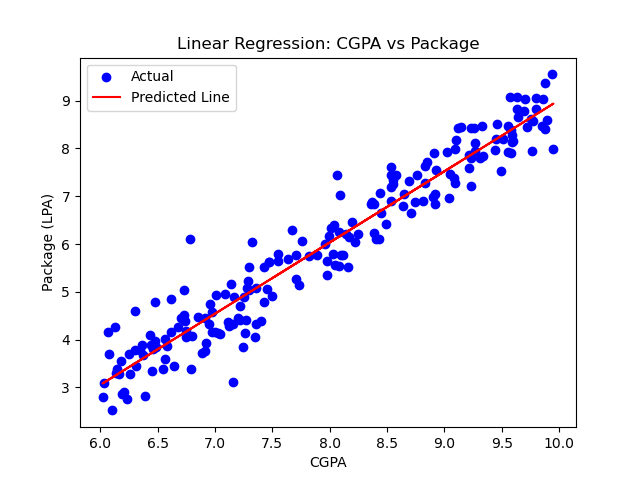
Linear Regression
I created a linear regression model to analyze the relationship between CGPA and the salary package offered to students. I used a dataset containing 200 records, each with a student's CGPA and their corresponding package in LPA. To simulate real world variation, I introduced some random noise to the data while keeping the overall trend linear. After training the model, I observed that package values tend to increase with higher CGPA, as expected. The regression line fit the data well, and I was able to use the model to make predictions for new CGPA inputs. This helped me understand how academic performance can statistically influence placement outcomes.
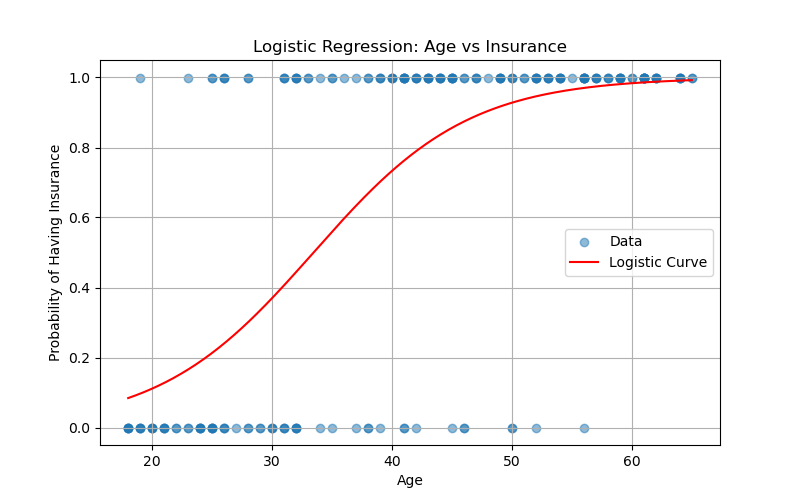
Losgistic Regression
I trained a logistic regression model to predict if a person has insurance based on age. Using a dataset of 200 samples, the model learned that the likelihood of having insurance increases with age. I split the data, trained the model, and visualized the sigmoid curve showing this trend. The evaluation showed good classification performance, helping me understand how logistic regression handles binary outcomes based on continuous inputs.
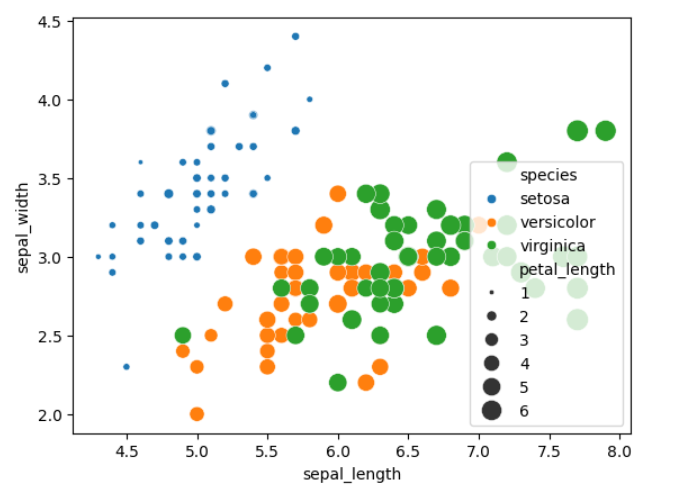
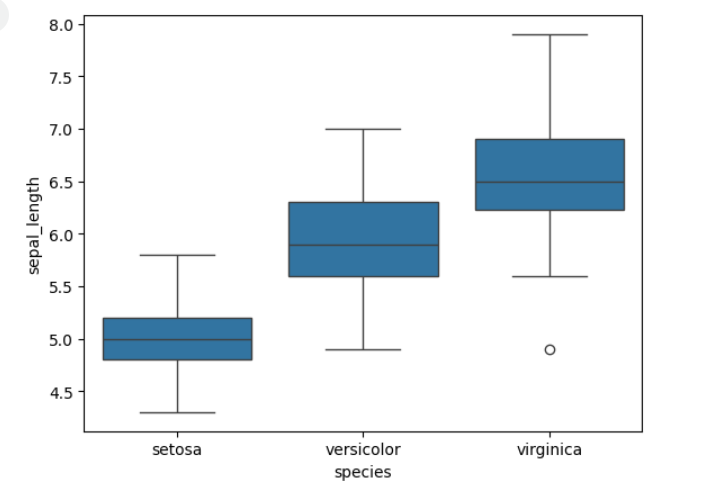
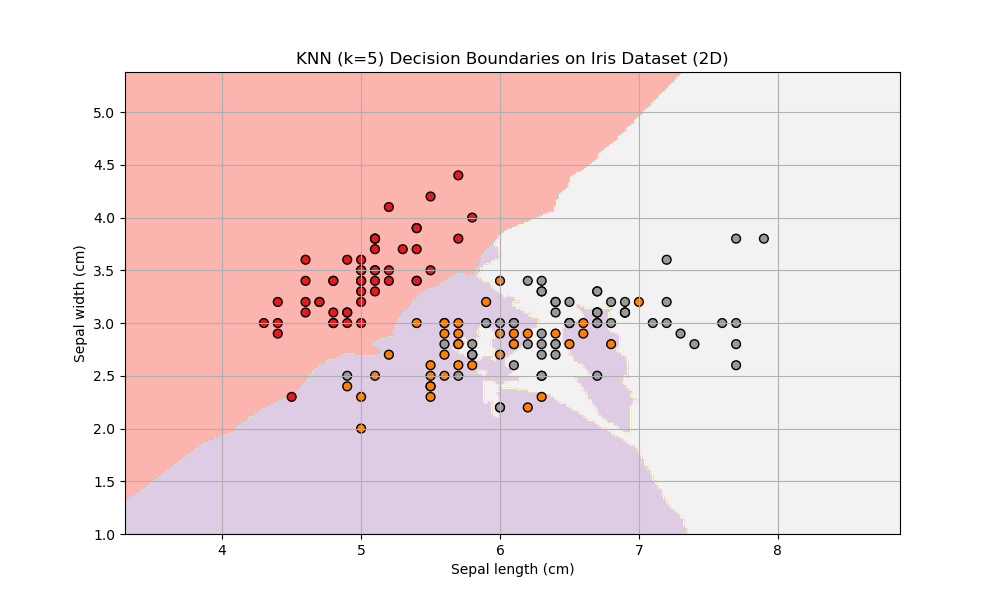
TASK 8: K- Nearest Neighbor Algorithm
I used the K-Nearest Neighbors algorithm to classify the Iris flower dataset. This dataset contains measurements of different Iris flowers along with their species labels. I trained the KNN classifier using the sepal length and sepal width features to predict the flower species. After splitting the data into training and testing sets, the model achieved perfect accuracy on the test data. I also visualized the decision boundaries in 2D, which clearly show how the model separates the different species based on the feature values. Overall, this classification task demonstrated how KNN can effectively categorize data points based on their nearest neighbors in feature space.
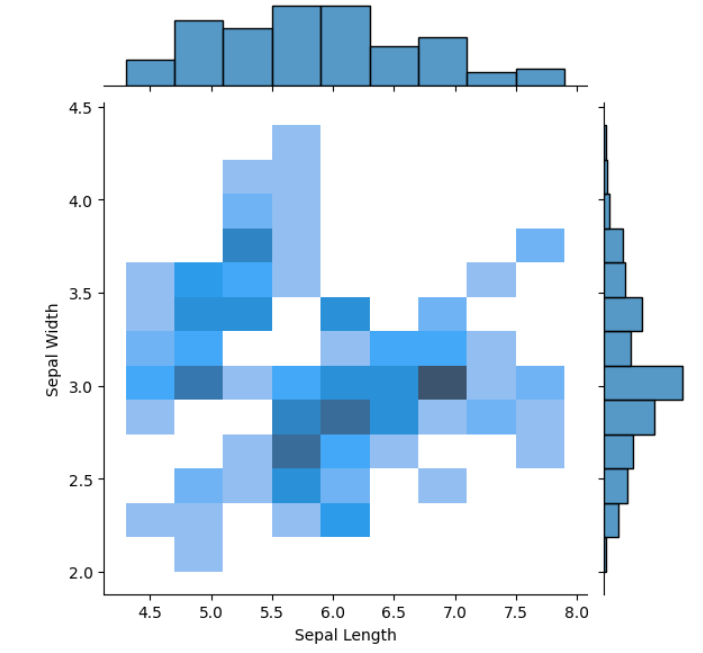
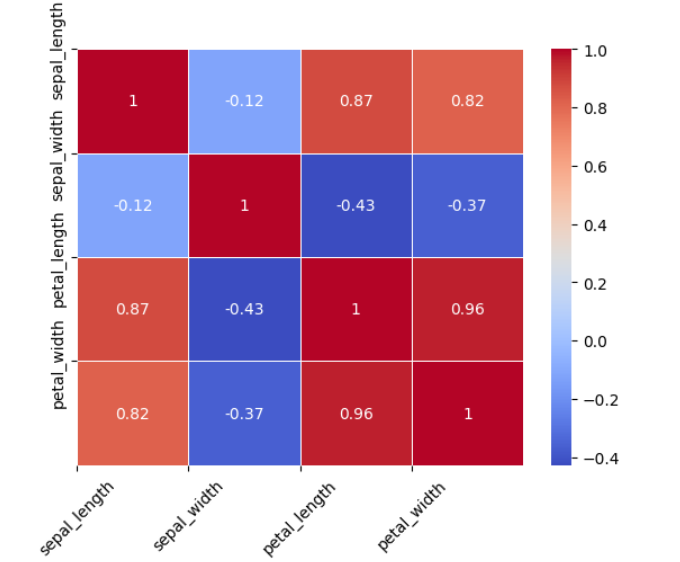
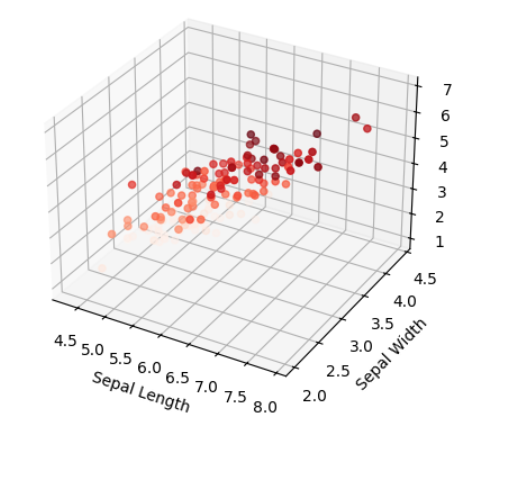
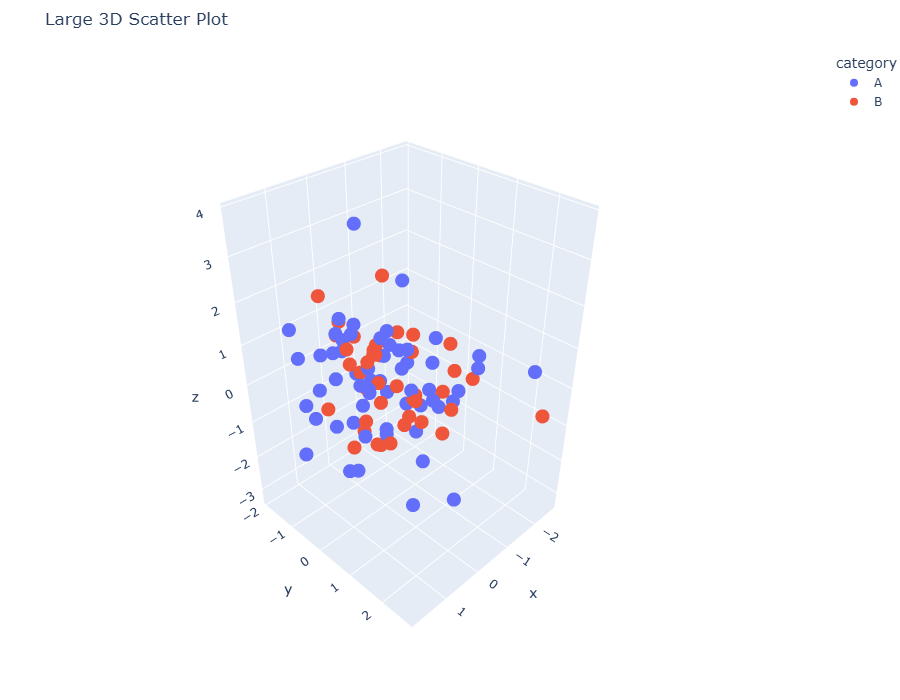
TASK 9: Data Visualization for Exploratory Data Analysis
I’ve learned how to create cool interactive charts with Plotly in Python. I can make scatter plots to see how different things relate, pie charts to show parts of a whole, and even 3D scatter plots to look at data from all angles. I figured out how to make the plots bigger so they’re easier to see. What’s awesome is that Plotly lets me zoom in, move around, and hover over points to get more info, which really helps me understand the data better. Overall, Plotly is a super handy and fun tool for making data look good and easy to explore.
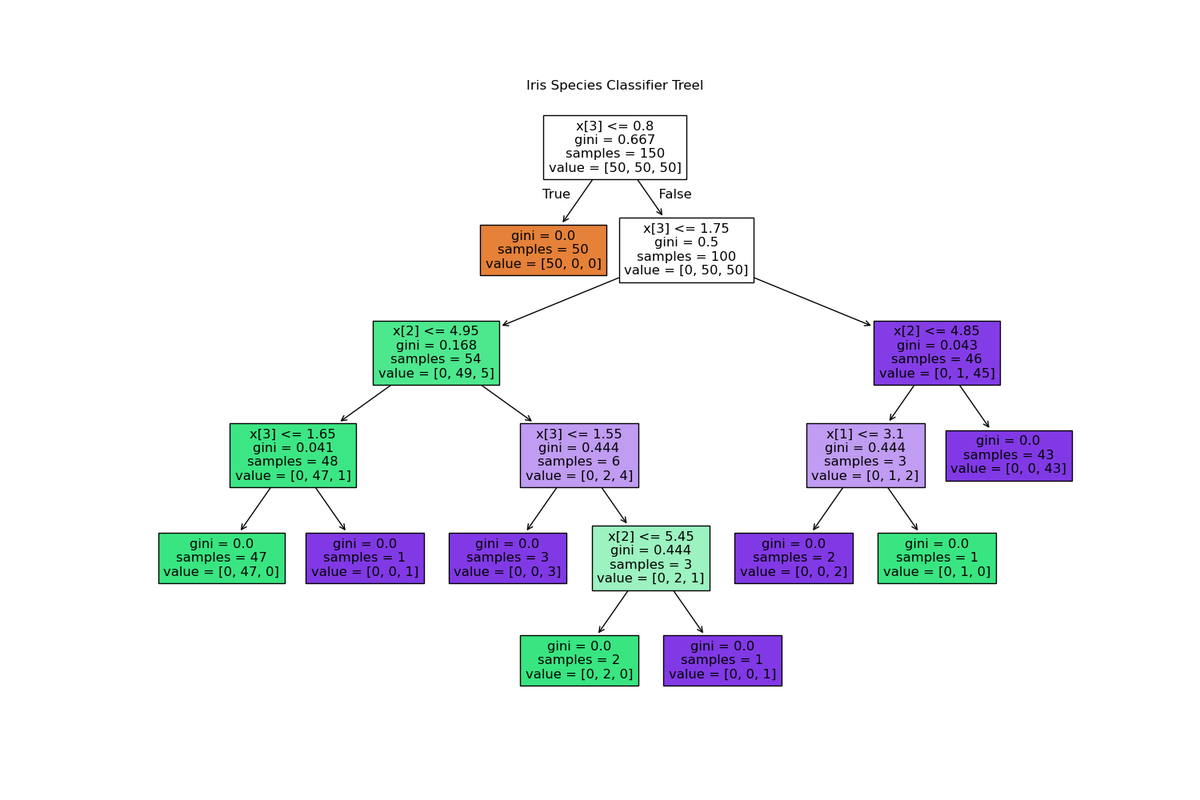
TASK 10: An introduction to Decision Trees
I built a decision tree model to classify the species of Iris flowers using the famous Iris dataset. The tree starts by splitting on petal width to separate setosa. From there, it further branches based on petal length and width to distinguish between versicolor and virginica. The model uses Gini impurity to decide the best splits at each node, ensuring the groups become purer as we go deeper. For example, one of the main splits for differentiating between versicolor and virginica happens at x[3] <= 1.75. The tree effectively classifies the three species with minimal misclassification, and most of the leaf nodes show pure or nearly pure groups. Overall, this decision tree gives a clear and interpretable structure for understanding how the Iris flower species can be classified based on petal and sepal measurements.
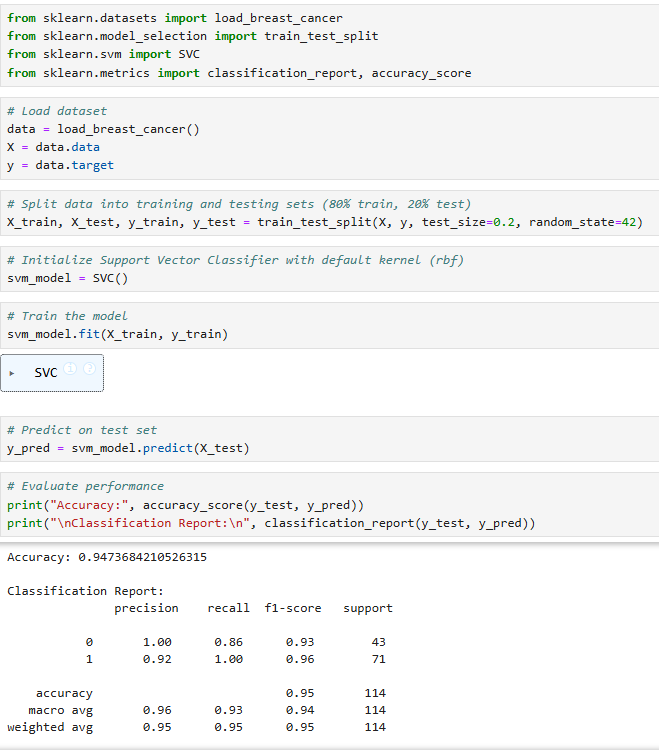
TASK 11: SVM
I applied Support Vector Machines to detect the likelihood of breast cancer. By training the model on tumor feature data, I was able to classify tumors as either benign or malignant. The SVM works by finding the optimal boundary that separates these two classes, which makes it well suited for this diagnosis task. After training and evaluating the model, I assessed its accuracy and other performance metrics. This experience demonstrated how machine learning can aid in the timely and accurate detection of breast cancer, an important step in medical diagnosis.