COURSEWORK
Ganavi's IOT-001 course work. Lv 1
| Ganavi Gowda | AUTHOR | ACTIVE |

Generic Task Report
4 / 10 / 2024
Ganavi's Level-0 report
TASK-01: Portfolio Webpage
Objective:
- By designing this portfolio we can present our skills,projects and we can showcase our designing approach and technical proficiency.
- Website should be responsive and pushed to the git repository.
- HTML and CSS should be used to design the portfolio.
Outcome and Learning:
- I have learnt HTML and CSS by buliding this website.
- Pushing this website code into my git repository.
- It is a platform to showcase my technical and designing skills,projects that i have made so far.
TASK-02: API[Application Programming Interface]
Objective:
- Buliding a web app using HTML,CSS,Javascript.
- Able to display necessary Information.
Outcome and Learning:
- Now I am capable of buliding a project on HTML, CSS and got a little knowledge about javascript.
- I have made a project on weather app which shows the temperature and climatic condition of specified palce.
- Vist my Weather App web page here: Link
- This is the code for this project: Refer code
TASK-03: Working with Github
Objective:
- Get familiarize with github actions,issues,pull requests,forking the code with this task.
Outcome and Leaning:
-
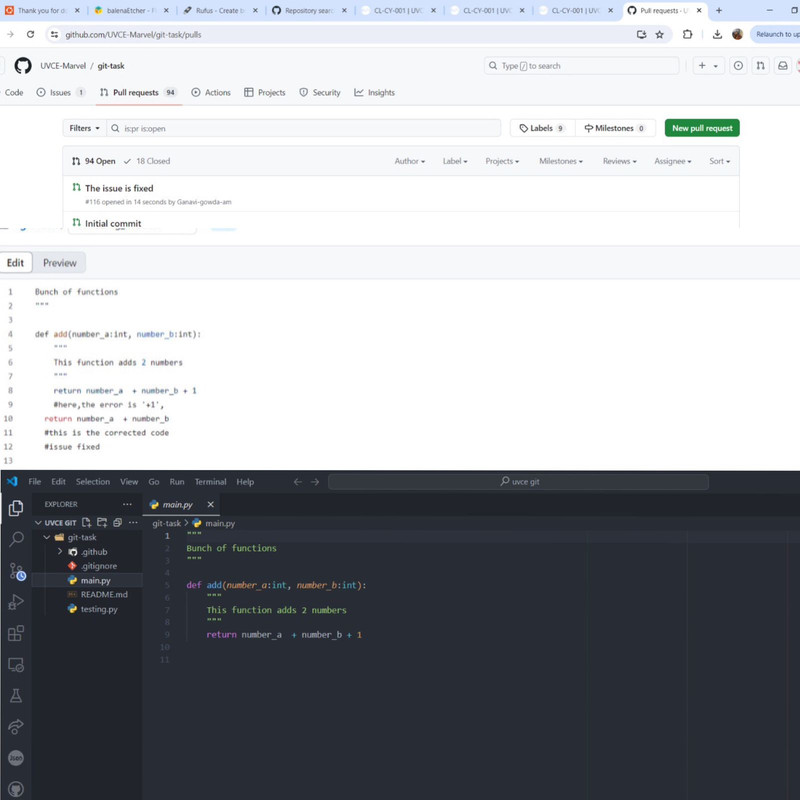
STEPS INVOLVED in this task is:
- 1. Forking the repository.
- 2. cloning the Repository.
- 3. Explore the Repository.
- 4. Working with issues.
- 5. Comment the changes on how to fix it.
- 6. Send the pull request to the original repository.
TASK-04: Writing Resource Article Resource Usiing Markdown
Objective:
- It is an markup language used with plain text to add formatting elements without using any formal text editor or HTML tags.
Outcome and Learning:
- I learnt to use markdown language.
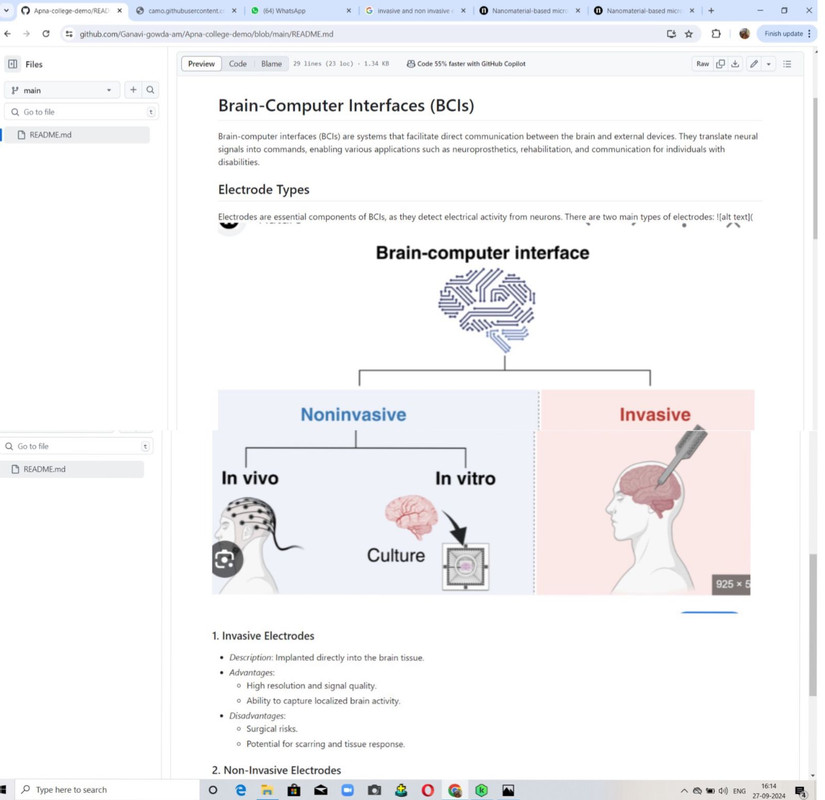
- I wrote an article on Brain Computer Interface[ BCI].
- This is the code for this project:Refer code
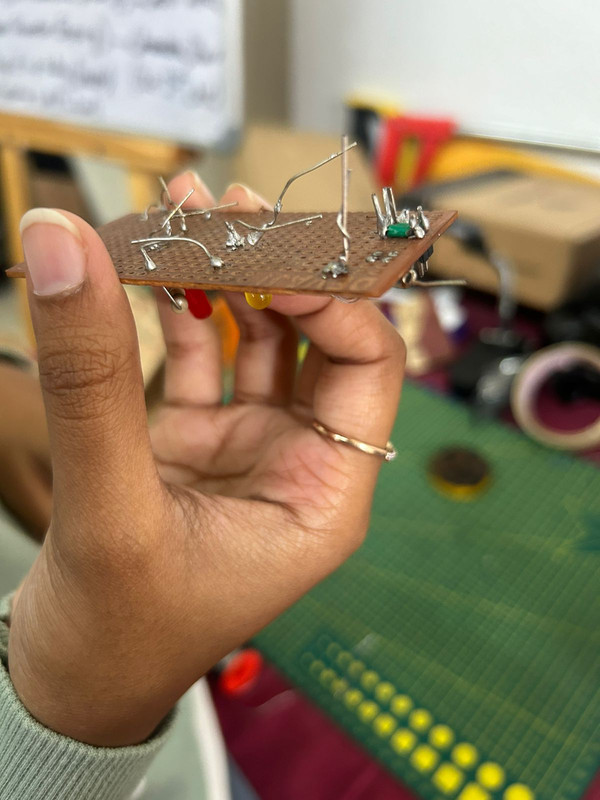
TASK 05: Soldering
Objective:
- Learn about soldering wire(tin-63%,lead-37%).
- Learn about wick,flux etc..
Outcome and Learning:
- I learnt how to solder the LED light to the circuit board using a soldering wire made of alloy tin and lead.
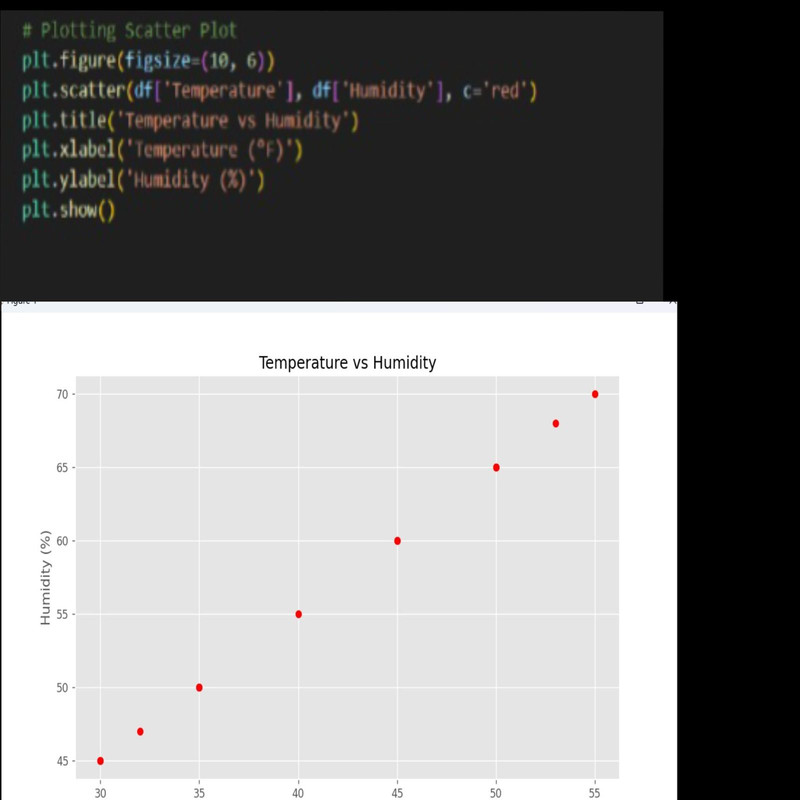
TASK 06: Working with Pandas and Matplotlib
Objective:
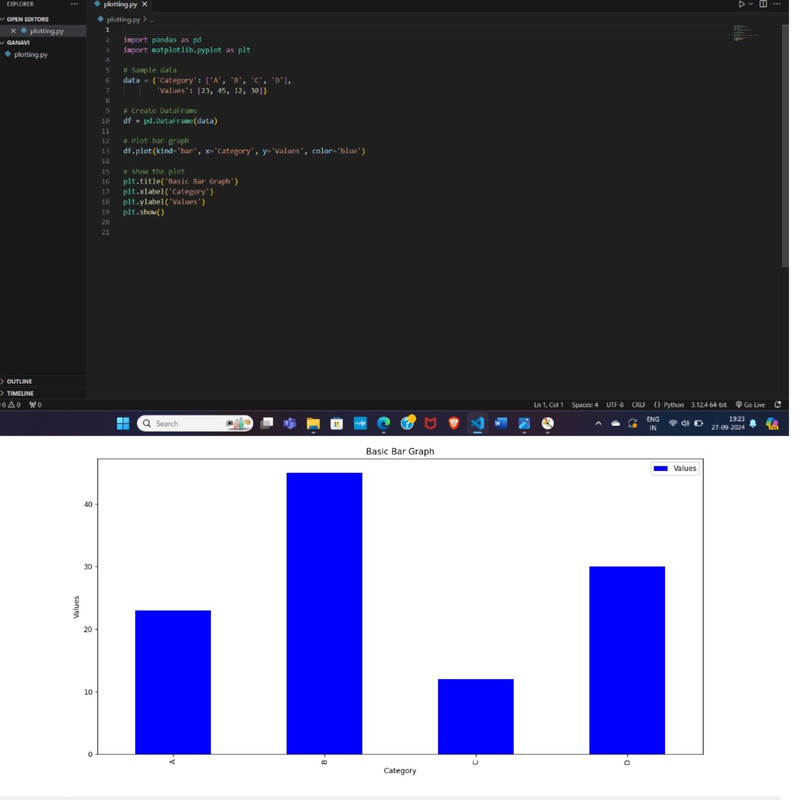
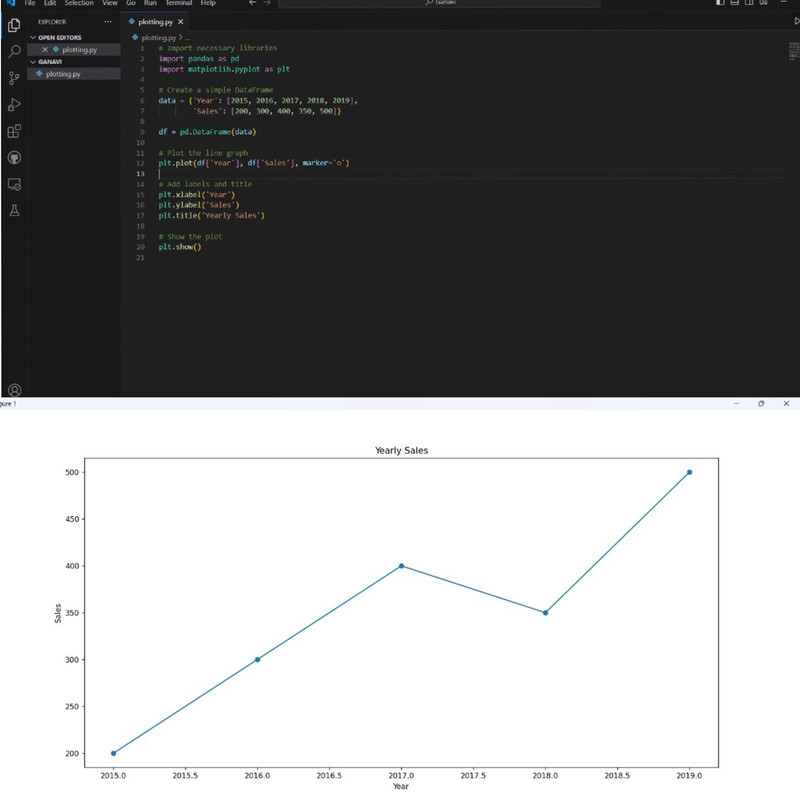
- Using pandas,matplotlib and dataset of our choice,we are ploting Bar,Line,Scatter graph.
Outcome and Learing:
- I learnt how to plot the given graphs byb using Pandas and matplotlib.
1. BAR GRAPH
2. LINE GRAPH
3.SCATTER GRAPH
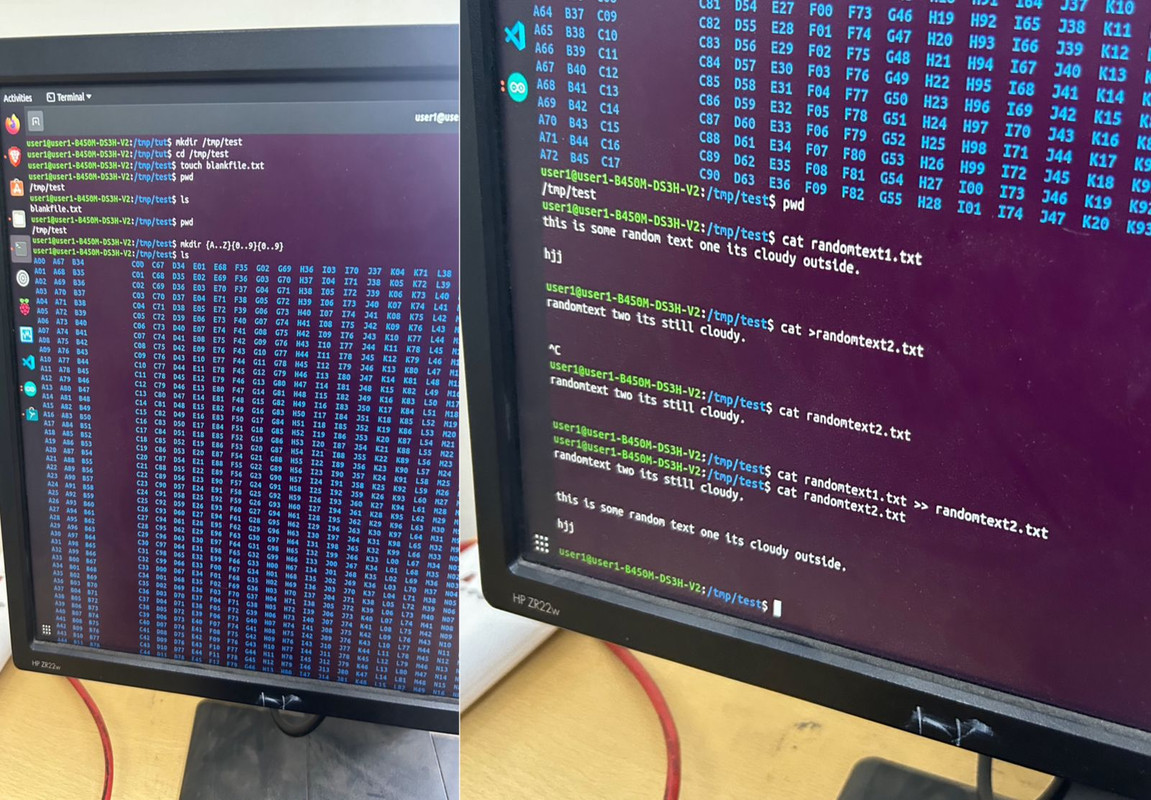
TASK 07: Get familiar with the command line on Ubuntu
Objective:
- Create a folder.
- Change directory(cd)-to that folder.
- Create a blank file without any text editor
- list(ls) the files in that folder.
- Create 2600 folders in this folder for example:A1,B1.
- Write any random text in any 2 files and concatenate them.
Outcome and Learning:
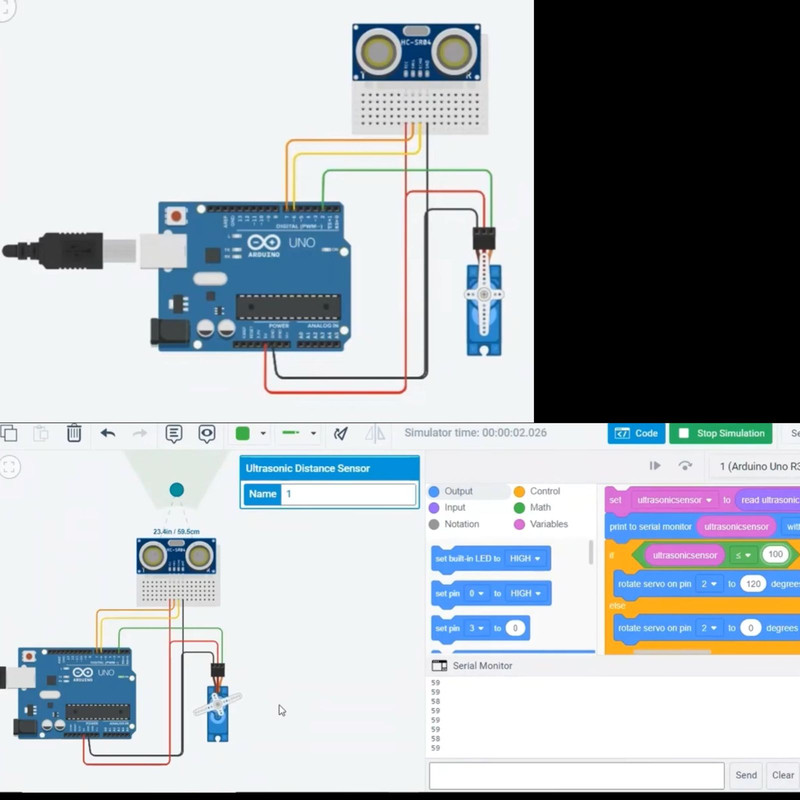
TASK 08:TinkerCad
Objective:
- To create a tinkercad account.
- To build simple circuit to estimate the distance between the ultrasonic sensor and the object.
Outcome and Learning:
Components Required:
- Ultrasonic Distance Sensor(4-pin).
- Arduino Uno R3.
- Micro Servo.
The distance between the ultrasonic sensor and the object is calculated based on the time it takes for the reflected ultrasonic wave to reach the receiver. The formula used for this calculation is:
𝑑=𝑠⋅𝑡
where:
𝑑 = Distance between the object and the ultrasonic sensor
s = Speed of the ultrasonic wave signal
t = Time taken by the reflected signal to reach the receiver
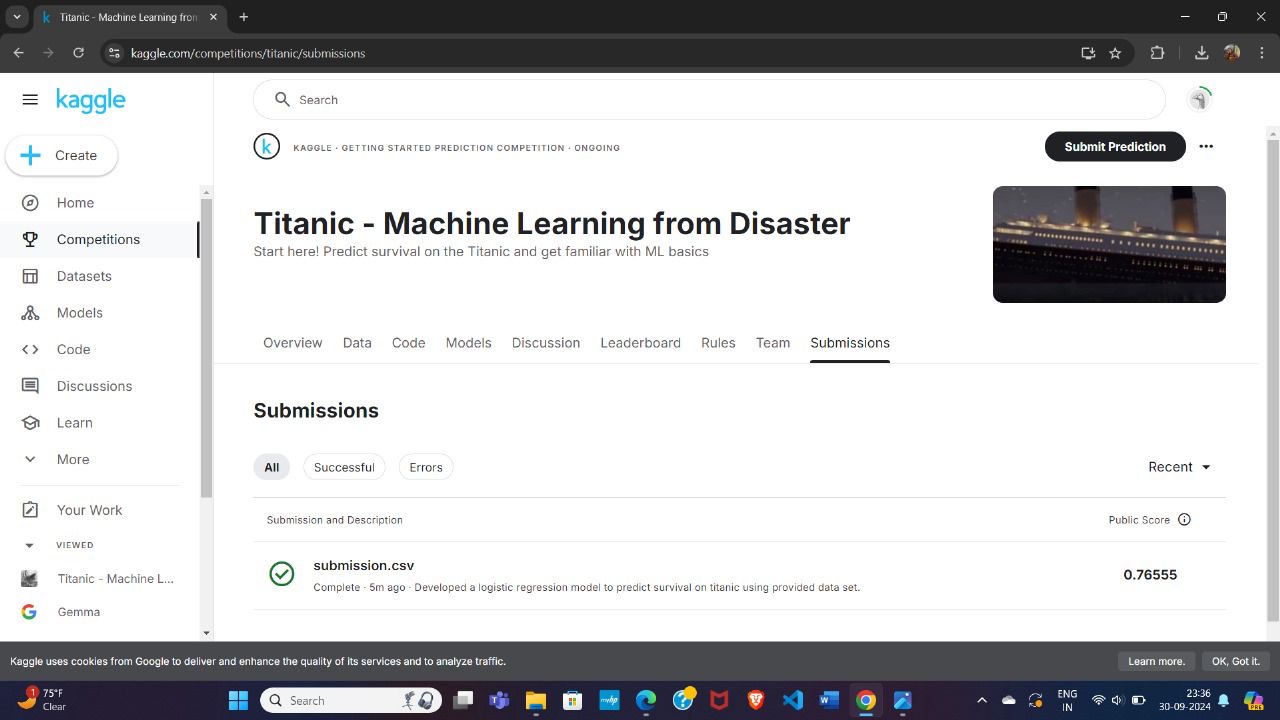
TASK 09: Kaggle Contest
Objective:
- To create a Kaggle account.
- Get familiarize with machine learing.
- Learn predicting the cases.
Outcome and Learning:
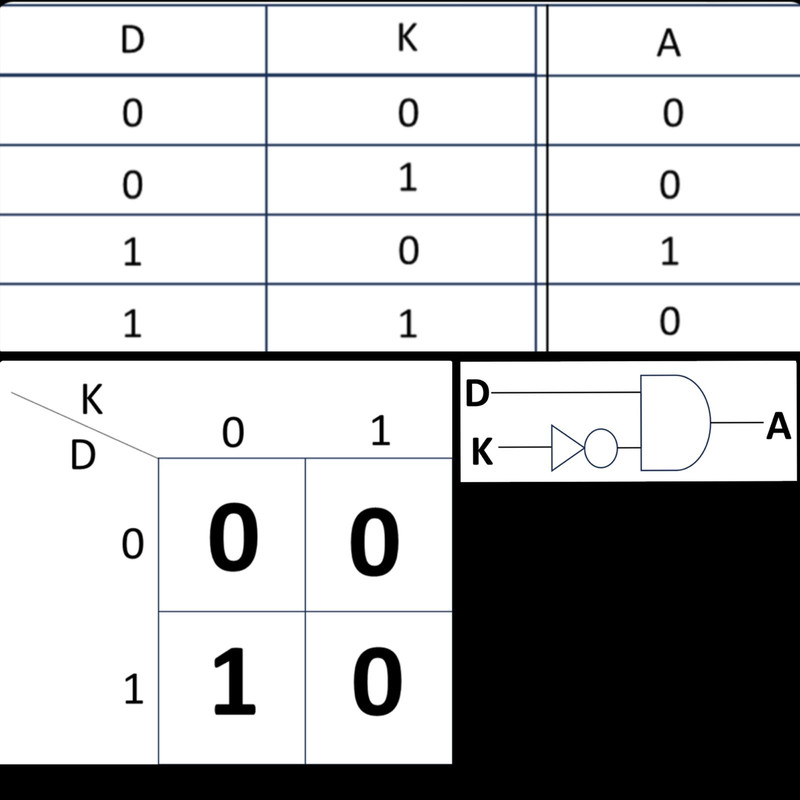
TASK 10: K-Map & Deriving Logic Gates
Objective:
- Determine the Karnaugh map and make Burgler alarm using simple circuits.
- Buzzing sound should be heared when it meets the certain conditions.
Outcome and Learning:
-
Here,
- D-door
- where, 1 denotes door is open.
- 0 denotes door is closed.
- K-key
-where, 1 denotes key is put.
- 0 denotes key is not put.
- D-door
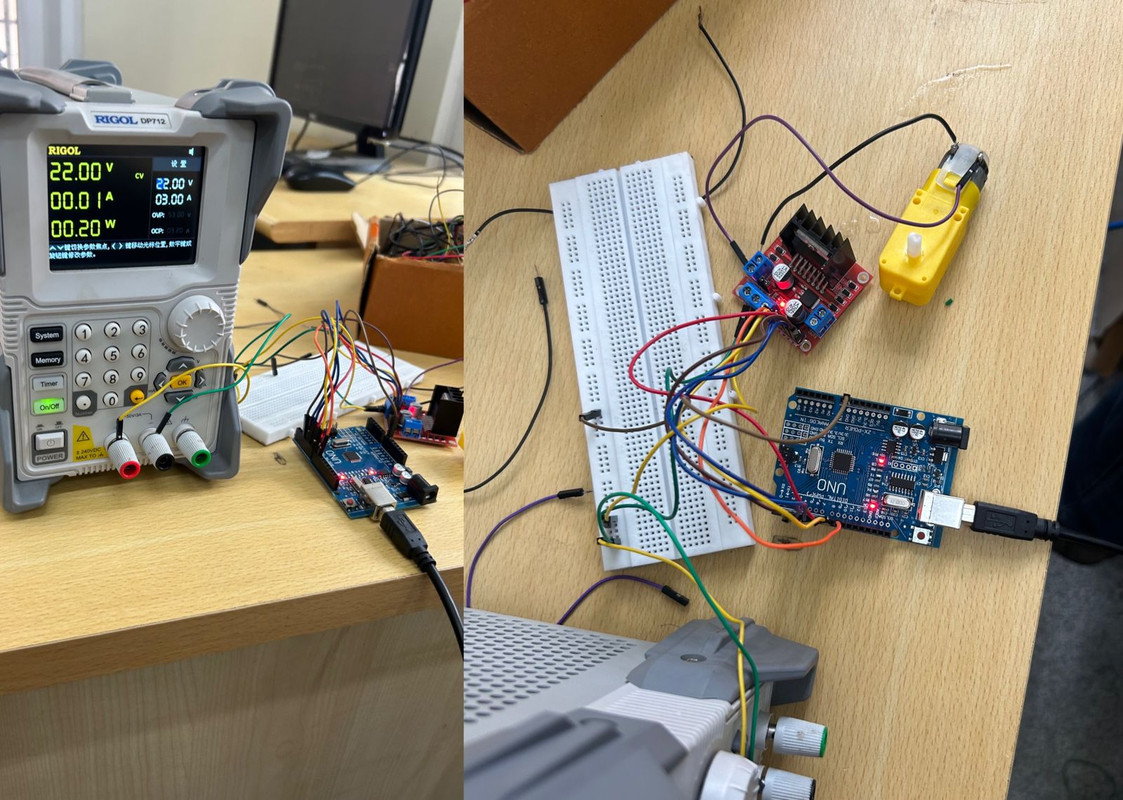
TASK 11: Speed control of DC motor using L298N driver
Objective:
- Using Arduino and L298N motor driver we should control the speed of the DC motor of 5V.
Outcome and Learning:
- The speed of a DC motor can be controlled by changing its input voltage. A widely used technique to accomplish this is Pulse Width Modulation (PWM). PWM is a technique in which the average value of the input voltage is adjusted by sending a series of ON-OFF pulses.
- This average voltage is proportional to the width of the pulses, which is referred to as the Duty Cycle. The higher the duty cycle, the higher the average voltage applied to the DC motor, resulting in an increase in motor speed.
- The shorter the duty cycle, the lower the average voltage applied to the DC motor, resulting in a decrease in motor speed.
TASK 12: Active Participation
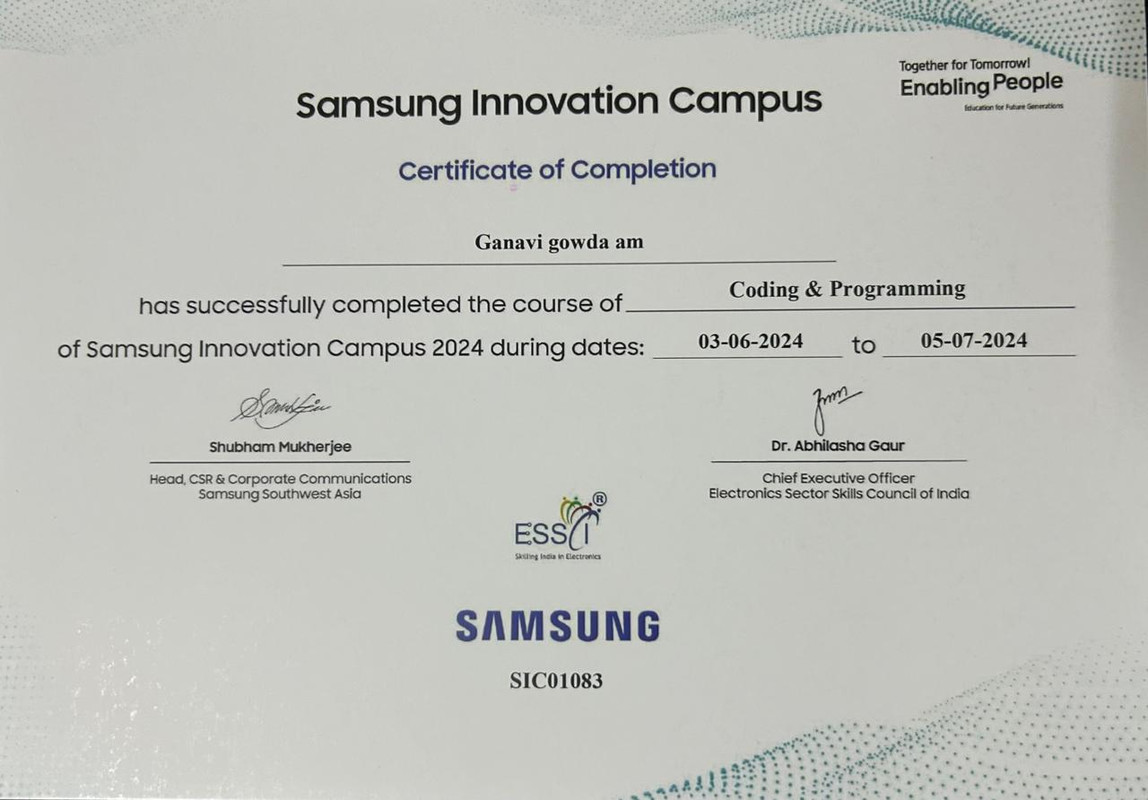
- I attended the 1 month course on python conducted by our college and I also participated in hackathon conducted by samsung comapany.
TASK 13: Introduction to VR
Objective:
- Know about VR and difference between VR and AR.
- Know about application of it in space and technology and its application in indian companies.
Report:
-
click below link to view the report.
TASK 14: Datasheet report writing
MQ135 Gas Sensor
INTRODUCTION
The MQ135 is a gas sensor widely used for detecting a variety of harmful gases, including ammonia, sulfur, benzene, smoke, CO2, and other gases. It operates on the principle of changes in the resistance of the sensing material in response to the presence of gas. The MQ135 sensor is highly sensitive and has a quick response time, making it suitable for a wide range of applications.

Calibration for Different Gases
The calibration process involves exposing the sensor to a known concentration of a particular gas and measuring the output to create a reference point. The sensor's response to various gases can be characterized by its sensitivity curves, which are typically provided in the datasheet.
Calibration Procedure:
- Power the Sensor: Connect the sensor to a 5V power supply and let it preheat for the recommended time (typically 24 hours for initial calibration).
- Expose to Known Gas Concentration: Place the sensor in an environment with a known concentration of the target gas.
- Record the Resistance: Measure the resistance of the sensor (Rs) in the presence of the gas.
- Calculate the Ratio: Calculate the ratio of Rs to the resistance in clean air (Ro). This ratio is used to determine the concentration of the gas using the sensitivity curve
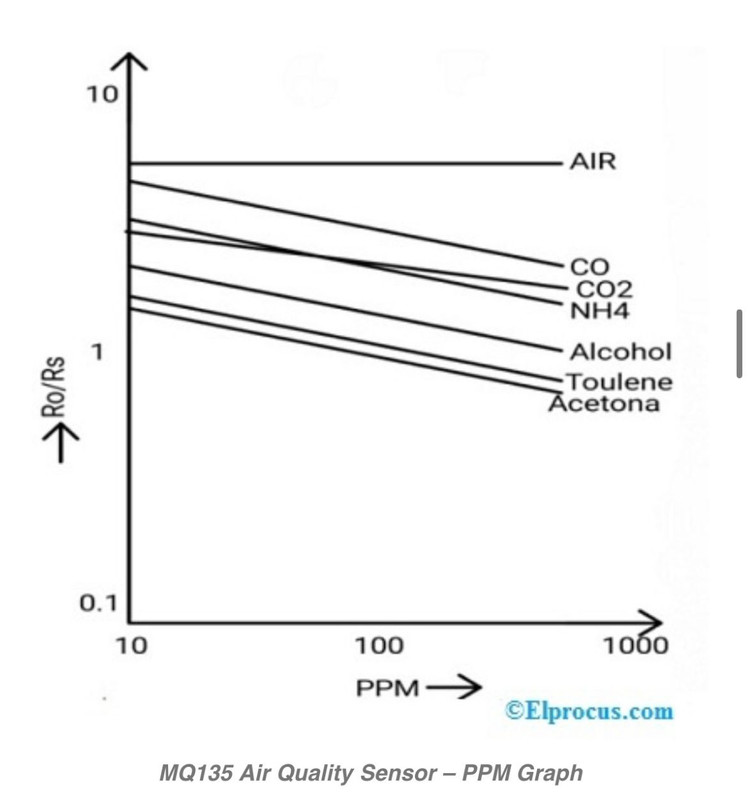
The sensitivity curves of the MQ135 sensor show the relationship between the gas concentration and the Rs/Ro ratio. Each gas has a distinct curve, which allows for the detection and estimation of its concentration.
Freundlich Absorption
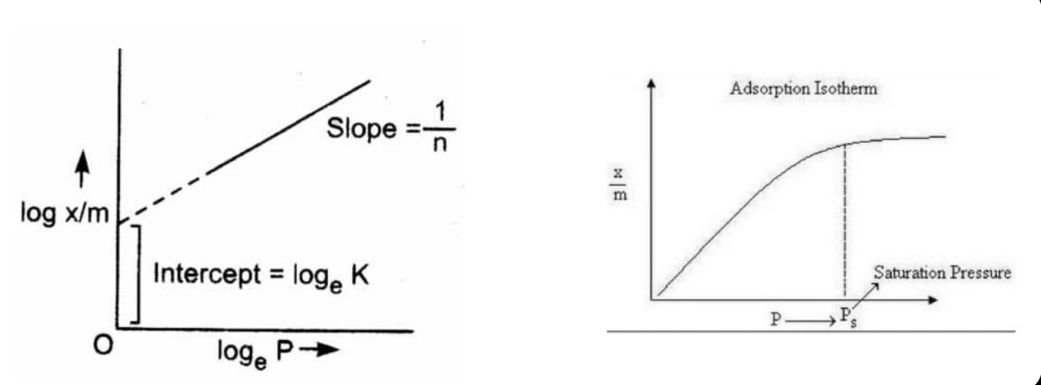 The Freundlich Absorption Isotherm describes the adsorption of gases on a solid surface, which can be represented by the equation :
x/m = kp^(1/n)
Where:
- x/m - is the amount of gas adsorbed per unit mass of adsorbent.
- P - is the pressure of the gas.
- k- and n are constants that depend on the system.
For the MQ135 sensor, the Freundlich Absorption graph helps in understanding the adsorption properties of the sensing material and its interaction with different gases.
Application
The applications of the MQ135 quality sensor are,
- Used in the detection of excess or leakage of gases like nitrogen oxide, ammonia, alcohol, aromatic compounds, smoke, and sulfide.
- Used as air quality monitors.
- Used in air quality equipment for offices and buildings.
- Used as a domestic air pollution detector.
- Used as an industrial air pollution detector.
- Works as a portable air pollution detector
