
RESOURCE · 4/4/2023
Pandas and Matplotlib for data Visualisation
This article guides the data visualisation process using Pandas and Matplotlib.

Reading CSV / Required Imports for Matplotlib & Pandas:\n\nFor reading data from a .csv file we will need pandas module pre-installed but before installing the pandas module we have to install pip module using the windows terminal. When we install python, we will already have an executable file pip.exe.\n So we have to find where is our pip.exe file by typing: 'where pip' command without quotes. By this we get the location where pip.exe file is present.\n\nSo, we have to change the present directory in the command prompt to the specified location where pip is present. Then to install pip, we have to type the command: 'pip install package_name' without quotes. This completes installation of pip. The pip module basically maintains all the modules and libraries in python.\n\n Now using pip, we will install the matplotlib module using the command: 'pip install matplotlib' without quotes. We will also install pandas module using pip by using command: 'pip install pandas' without quotes. So, all the required module installations are complete till now.\n\n Next we can begin to code using a text editor such as Visual Studio Code.We will give a name to the file with .py extension.We start all codes by: \nimport matplotlib.pyplot as plt\nimport pandas as pd\nimport numpy as np\n\n Then we can get the data from a csv file which is a comma separated values file using the code:\nvar=pd.read_csv('filename.csv')\n\n * Visualising Your Data:*\n\n\nPandas has a built in .plot() function as part of the DataFrame class. It has several key parameters:\n\nkind — ‘bar ’barh ’pie ’scatter ’kde’ etc which can be found in the docs.\n\ncolor — Which accepts and array of hex codes corresponding sequential to each data series / column.\n\nlinestyle — ‘solid’, ‘dotted’, ‘dashed’ (applies to line graphs only)\n\nxlim, ylim — specify a tuple (lower limit, upper limit) for which the plot will be drawn\n\nlegend— a boolean value to display or hide the legend\n\nlabels — a list corresponding to the number of columns in the dataframe, a descriptive name can be provided here for the legend\n\ntitle — The string title of the plot\n\n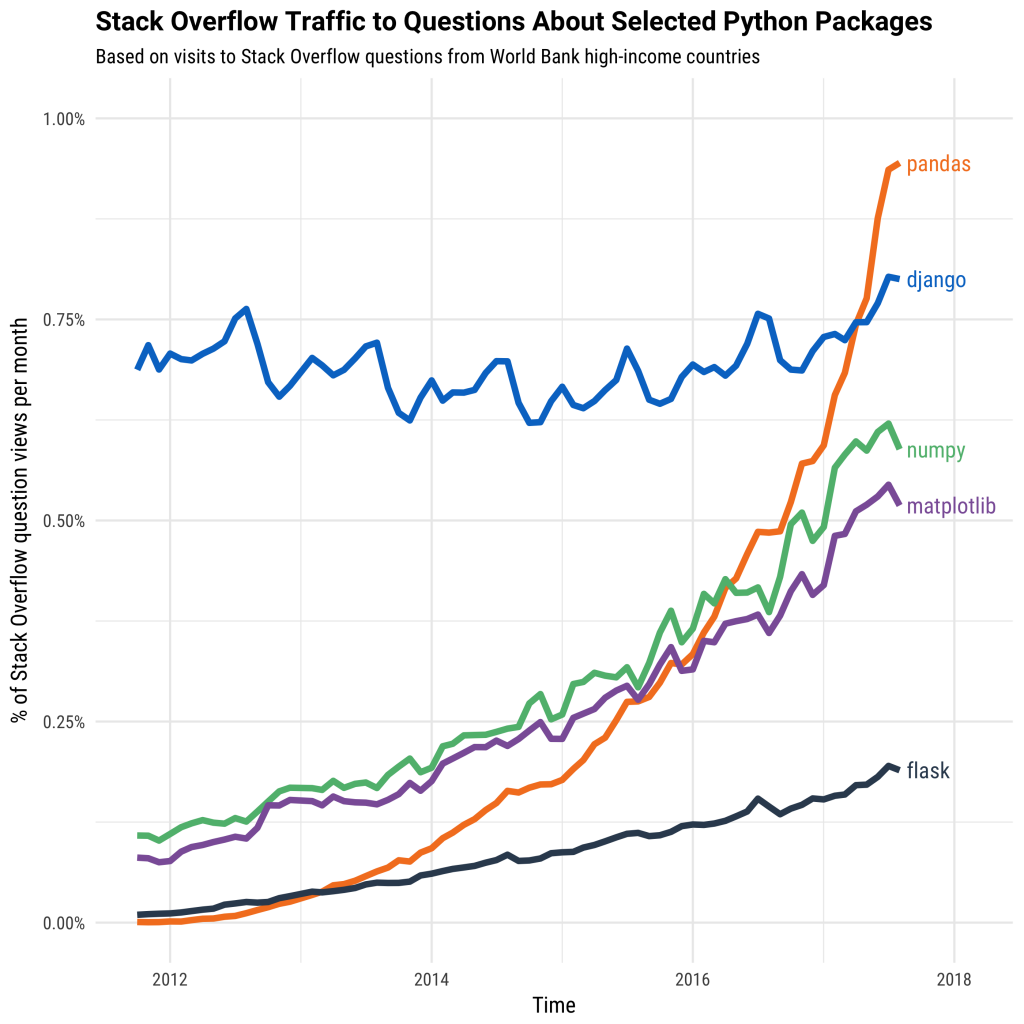 \n\nPandas is best suited for structured, labelled data, in other words, tabular data, that has headings associated with each column of data\n\nplt.scatter() is used for plotting a scatter plot using dots at various places.\n
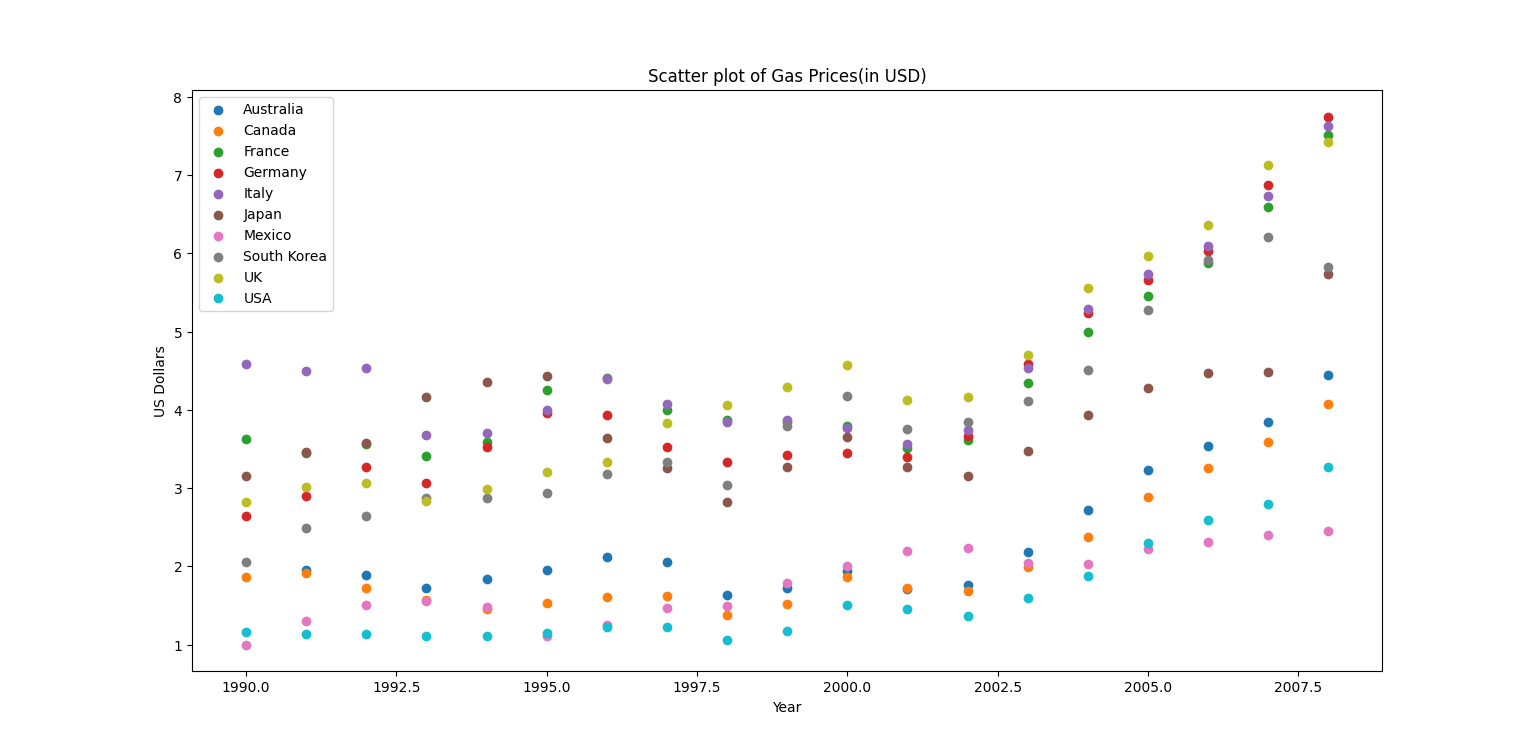 \n\nplt.plot() is used for plotting line plots for the obtained data. Here, we can also add dots at specific places in line plots using marker='.' inside the plt.plot() function.\n
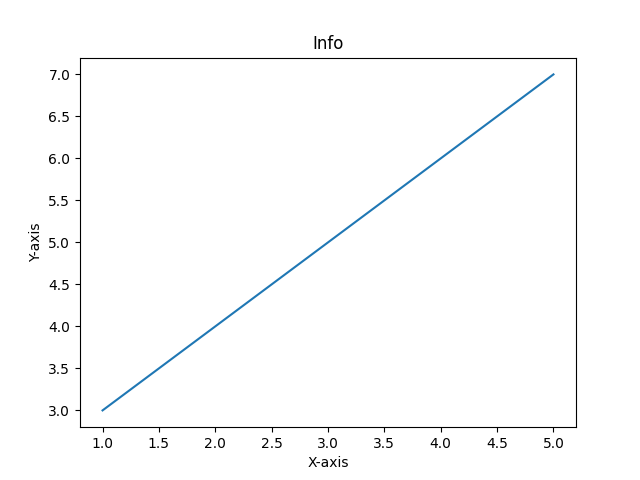 \n\n
\n\n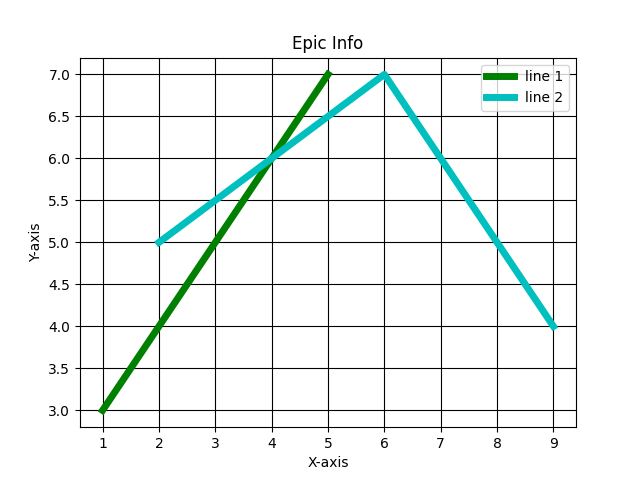 \n\n\nplt.bar() function is used for plotting bar graphs using the obtained/given data.\n
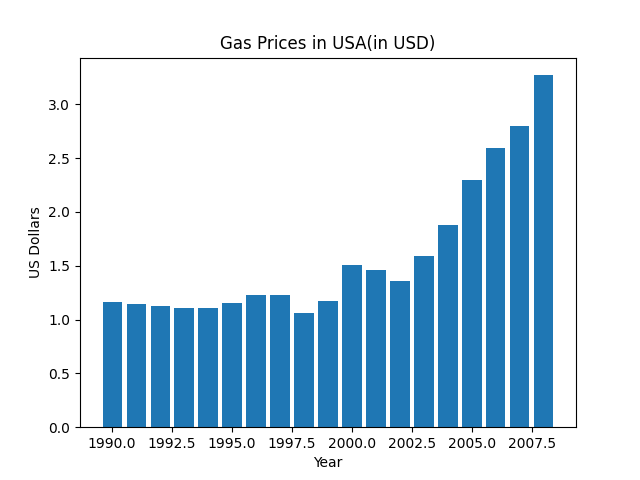 \n\nWe can also give plt.xlabel() and plt.ylabel() for labelling xaxis and yaxis and we can add a title to the plot using plt.title() function.\n\nFinally after all the code is writte we have to write the plt.show() function to display the plot created.